


The second quarter of this year saw some interesting themes play out across global markets, particularly in the US Dollar as strength came-back after the year-plus down-trend that started last year. As we move into the second half of the year, the prospect of continuation remains in a variety of these markets, and in this webinar, we used price action to look into these scenarios while previewing what might become most pertinent in Q3 and the second half of 2018.
Talking Points:
- If you’re looking to improve your trading approach, our Traits of Successful Traders research could help. This is based on research derived from actual results from real traders, and this is available to any trader completely free-of-charge.
- If you’re looking for a primer on the FX market, we can help. To get a ground-up explanation behind the Forex market, please click here to access our New to FX Trading Guide.
If you’d like to sign up for our webinars, we host an event on Tuesday and Thursday, each of which can be accessed from the below links:
Tuesday: Tuesday, 1PM ET
Thursday: Thursday 1PM ET
US Dollar Strength Comes Roaring Back, Prospect of More in 2H 2018
In the FX market, US Dollar strength re-emerged as a prominent theme, and this was largely driven by a dovish ECB and weakness in EUR/USD after the pairs bullish topside run last year. With the door opened for continued dovishness out of the ECB while the Fed remains persistently hawkish, forecasting an additional five rate hikes out the end of next year, it appears as though there’s room for rate divergence to continue to price through. This of course, could be constrained by a pullback in US inflation or perhaps even stronger European inflation: But from where we’re at, it does not look as though the ECB wants to hike rates until they have to while the Fed is heading full-speed towards normalization; at least until something changes that (like a larger equity sell-off).
US Dollar Daily Chart: Bullish Continuation Potential After Q2 Shift

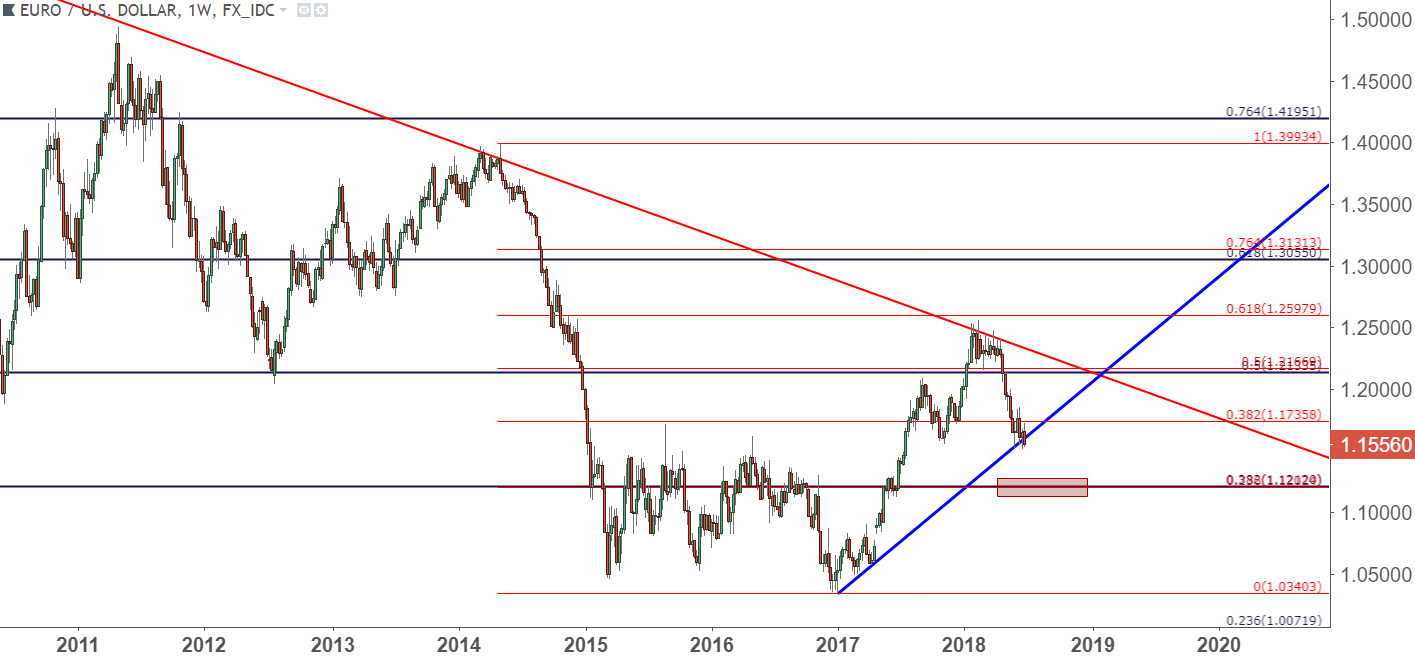
EUR/USD Holding Above 1.1500 For Now, But Door Open for Deeper Losses Towards 1.1200
This was the largest contributor to that influx of US Dollar strength, as both USD strength and EUR/USD weakness began to show with a bit more prominence around the April ECB rate decision. Shortly after that, European political risk re-entered the equation, and this largely denominated May price action in the pair. A bounce showed in early-June, but this was largely driven by the premise of the ECB rolling out a strategy for stimulus exit, as had been warned of by the ECB’s own Chief Economist, Peter Praet. But when we got to that June rate decision from the ECB, and once we heard how the bank plans to wind down stimulus, they soundly rebuked the bullish driver that had kept the bid behind the single currency: The ECB said that even after tapering bond purchases, the bank anticipates keeping rates at current levels ‘at least through the summer of 2019.’ This means that we might have one rate hike from the ECB to the end of next year while the Fed may pose five full hikes, or 125 basis points of adjustment.
This, combined with continued risk from European politics, could keep the pair heading lower into the second half of the year. The complication at the current juncture is one of price action positioning. We looked at a few different ways to work with the short side of the pair as we move into Q3.
EUR/USD Weekly Chart: Grasping on to Support
GBP/USD at 2018 Lows as Q3 Nears
Cable hasn’t been nearly as bashful as EUR/USD about driving down to fresh lows over the past week. While EUR/USD continues to hang above the swing at 1.1510, GBP/USD has just traded below a key Fibonacci level on the chart at 1.3117, and the pair is making a fast approach towards a key psychological level at the 1.3000-handle. This is pair that could present reversal potential as we move into the early portion of Q3: With the Bank of England getting a bit more hawkish at that last rate decision with three dissenting votes cast for an immediate rate hike, we may actually see an adjustment at the August Super Thursday rate decision; and even if we don’t see a move there, the bank opening the door for a possible move in November could help support begin to show. Watch the 1.3000 level for the development of support, as this could open the door for reversal strategies in the pair if it comes into play.
USD/CHF Retains Short-USD Appeal
USD/CHF started Q2 with a bang, continuing the near-parabolic like movement that had started towards the end of Q1. That strength largely remained through the first half of Q2, and prices eventually eclipsed the parity level before topping out around 1.0055. Since then, we’ve seen some bearish price action beginning to show even as the US Dollar remained strong, indicating that Franc-strength was starting to take-over a bit. That move has retraced and we’re now back to re-testing lower-highs underneath parity. If this holds, the door remains open for short-side. If it doesn’t, evaluate what happens at that prior swing high of 1.0055 and, if that holds, reversals can remain attractive.
USD/CAD Reversal After Pin Bar at Fibonacci Resistance
In Tuesday’s webinar we looked at a bearish pin bar near the 76.4% retracement of the June-September, 2017 major move. We didn’t spend much time on the setup, but after another test of that resistance level, CAD bulls have taken over and prices are driving down to fresh near-term lows. At this stage, a deeper pullback can make the prospect of bullish continuation an attractive theme to follow as we move into Q3.
USD/CAD Daily Chart: 76.4% Fibonacci Resistance
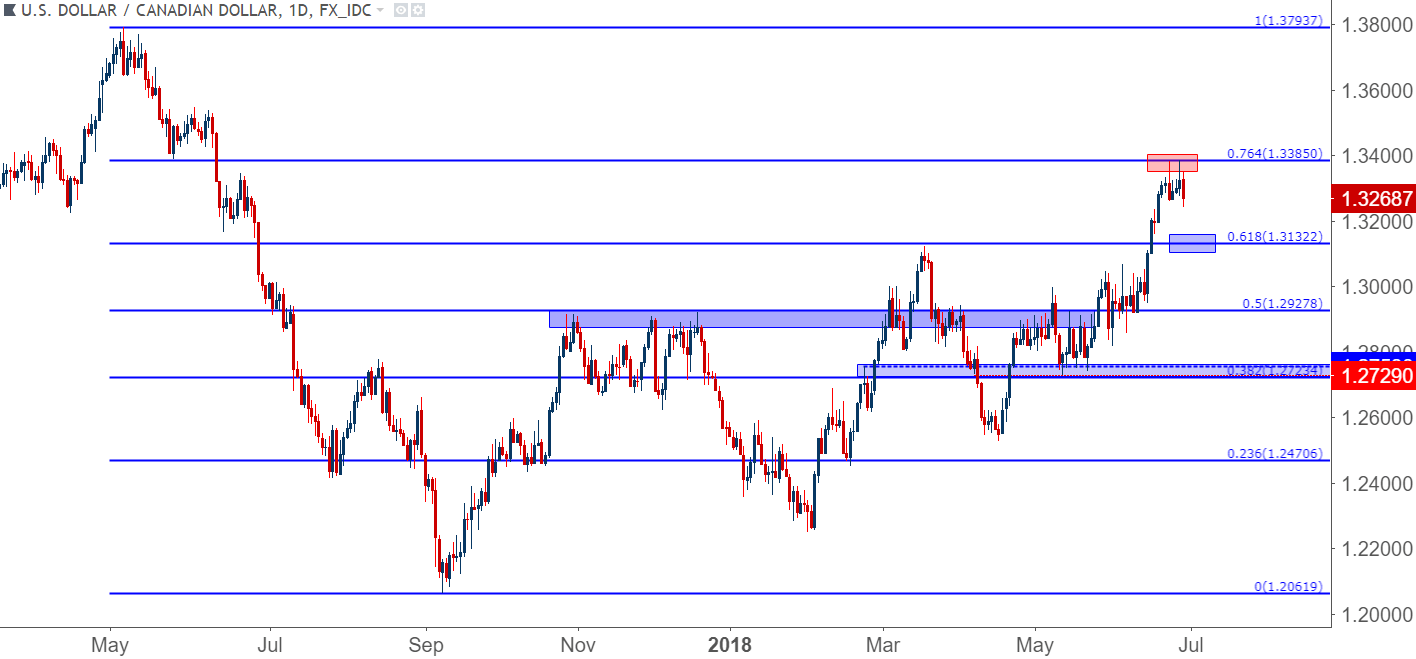
Chart prepared by James Stanley
To read more:
Are you looking for longer-term analysis on the U.S. Dollar? Our DailyFX Forecasts for Q1 have a section for each major currency, and we also offer a plethora of resources on USD-pairs such as EUR/USD, GBP/USD, USD/JPY, AUD/USD. Traders can also stay up with near-term positioning via our IG Client Sentiment Indicator.
Forex Trading Resources
DailyFX offers a plethora of tools, indicators and resources to help traders. For those looking for trading ideas, our IG Client Sentiment shows the positioning of retail traders with actual live trades and positions. Our trading guides bring our DailyFX Quarterly Forecasts and our Top Trading Opportunities; and our real-time news feed has intra-day interactions from the DailyFX team. And if you’re looking for real-time analysis, our DailyFX Webinars offer numerous sessions each week in which you can see how and why we’re looking at what we’re looking at.
If you’re looking for educational information, our New to FX guide is there to help new(er) traders while our Traits of Successful Traders research is built to help sharpen the skill set by focusing on risk and trade management.
--- Written by James Stanley, Strategist for DailyFX.com
Contact and follow James on Twitter: @JStanleyFX


