

Fundamental Forecast for Gold: Neutral
Talking Points:
- Gold Price Forecast: Subdued Rebound Keeps Bearish Trend Intact.
- XAU/USD Price Analysis: Gold Bounces From Fibonacci Support.
- Are you looking for longer-term analysis of Gold prices? Check out our Quarterly Forecasts as part of the DailyFX Trading Guides.
Fundamental Forecast for Gold: Neutral
Want to see how other traders are approaching Gold prices? Check out our IG Client Sentiment indicator.
Gold Prices Spend Second Week at Support Ahead of Heavy Headline Risk
The past three months have seen aggressively bearish price action take over Gold prices. After spending most of Q1 in a range, sellers started to gain control in mid-April as US Dollar strength began to show. That theme of USD-strength and Gold weakness remained through the rest of Q2 and into the first few weeks of Q3, until prices eventually ran into support last Thursday around the release of comments from President Trump regarding US interest rate policy. Current support continues to show at the 50% marker of the 2014-2016 major move. After a bounce from this area to close last week, prices have continued to test this level through this week’s price action but – to date, bears haven’t yet been able to make much ground. This highlights an interesting area of support in a key market ahead of a really big batch of headline risk on the economic calendar for next week.
Gold Daily Price Chart: Q1 Range Leads to Q2 Slump, Fibonacci Support Holds the Lows Past Week
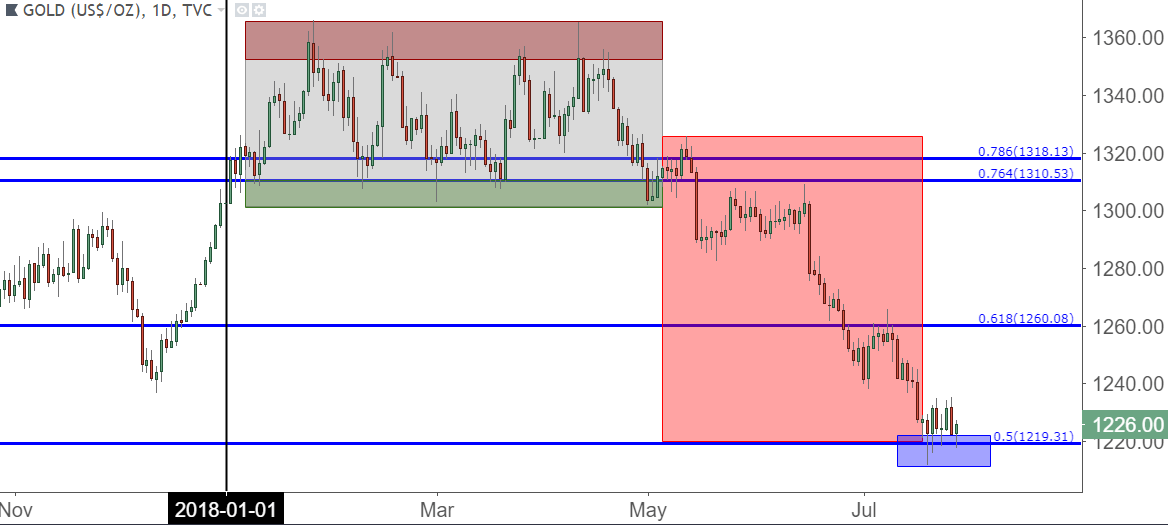
Chart prepared by James Stanley
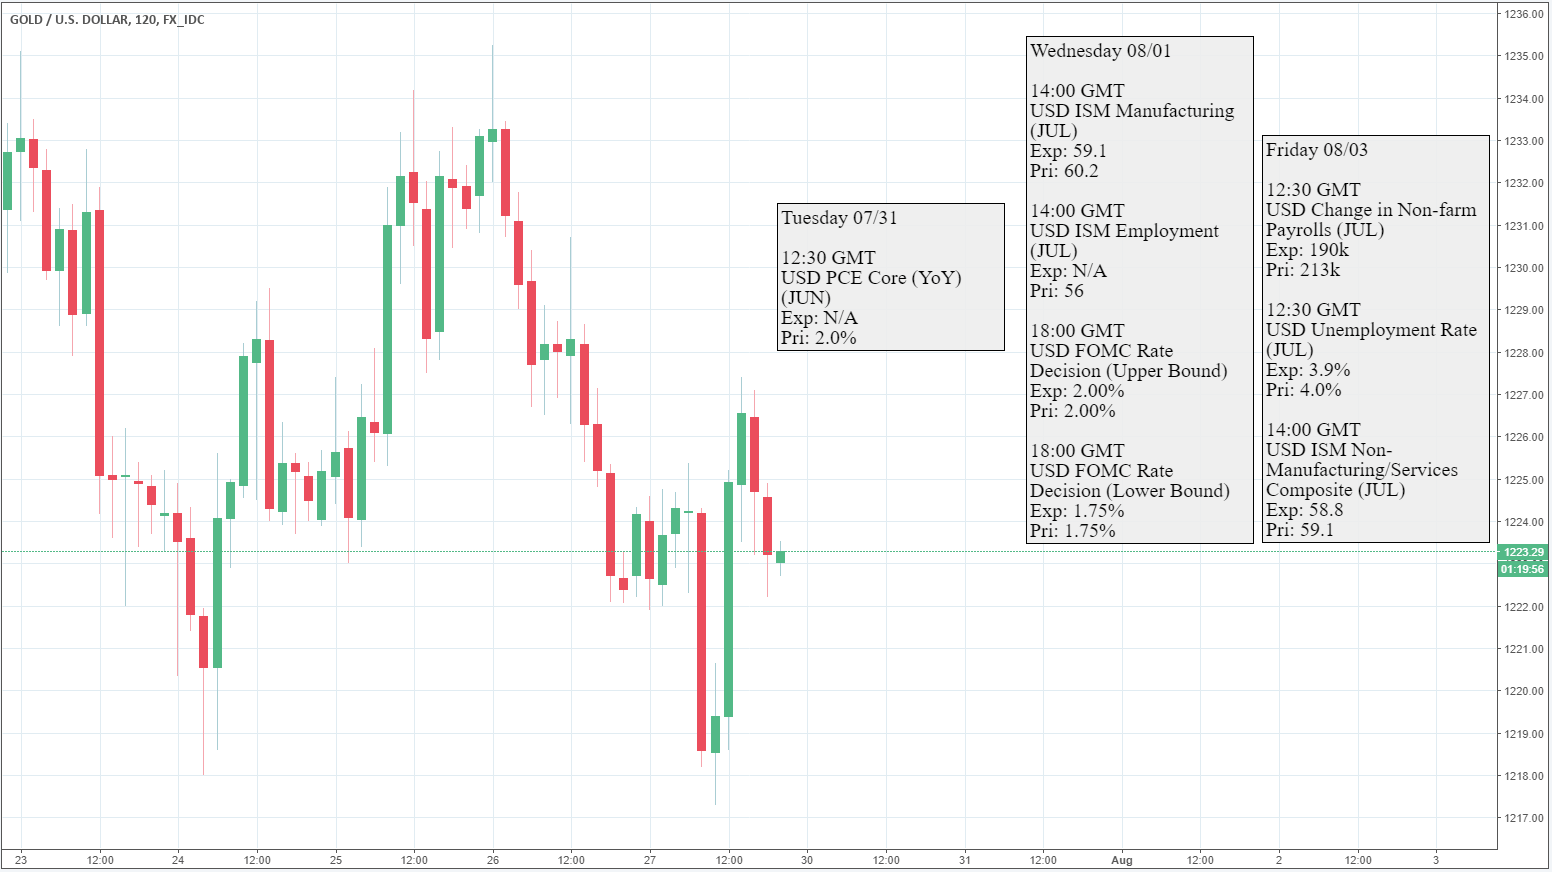
Next Week’s Calendar Brings Plethora of Headline Risk
Going along with this week’s back-and-forth price action in Gold was a similar such observation in the US Dollar. The Greenback’s Q2 up-trend was a key driver of the sell-off in Gold prices, and as Dollar strength has remained at bay this week, so has continued selling in Gold. But next week brings a plethora of headline risk as we get rate decisions from Central Banks in Japan, the US and the UK, along with the release of key inflation data out of Europe and jobs numbers out of the United States (NFP is on Friday). This makes for what could be an especially volatile backdrop as we have significant high-risk events on the calendar for every day next week.
DailyFX Economic Calendar: High-Impact FX Events for Week of July 30, 2018

Chart prepared by James Stanley
Retail Remains Heavily Long as Traders Continue to Try to Call a Bottom
While the selling in Gold has heated up, retail traders have continued to try to call a bottom. At this point, 85.9% of retail traders remain net long in Gold with a ratio of 6.07-to-1. With retail sentiment being utilized as a contrarian indicator, this would pose a challenge around the prospect of bullish strategies in Gold prices; and can even keep the door open to further bearish continuation.
Gold Retail Sentiment Remains Heavily Net-Long

Chart prepared by James Stanley
Gold Strategy For Next Week: Pullbacks and Breakouts
At this stage, the bearish trend remains attractive in Gold prices, but we’ve seen a lack of motivation from sellers as support has come into play over the past week. If we combine this with a heavy amount of risk from next week’s economic calendar, this makes for a difficult backdrop to try to chase well-developed trends. As such, our fundamental forecast for Gold prices next week will remain at neutral.
But the door can re-open to bearish strategies in Gold should the down-trend come back into play, and this can be looked for in two different ways: Playing a pullback to short-term resistance, which can offer bearish appeal as traders would have a point on the chart for stop placement. Or, alternatively, the door can open for bearish breakout strategies should prices break-down to a fresh low.
Gold Four-Hour Price Chart
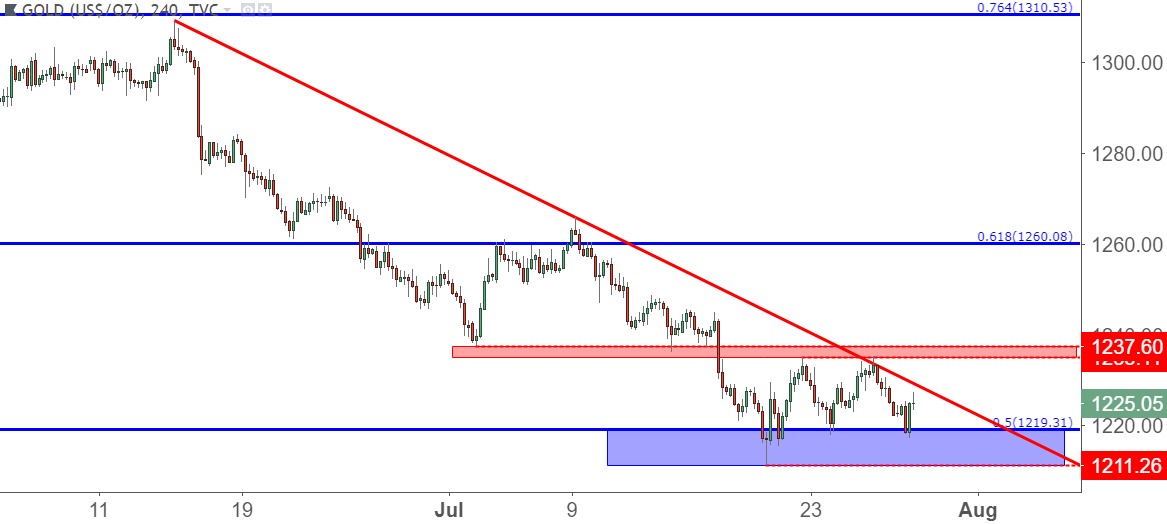
Chart prepared by James Stanley
To read more:
Are you looking for longer-term analysis on the U.S. Dollar? Our DailyFX Forecasts for Q1 have a section for each major currency, and we also offer a plethora of resources on USD-pairs such as EUR/USD, GBP/USD, USD/JPY, AUD/USD. Traders can also stay up with near-term positioning via our IG Client Sentiment Indicator.
Forex Trading Resources
DailyFX offers a plethora of tools, indicators and resources to help traders. For those looking for trading ideas, our IG Client Sentiment shows the positioning of retail traders with actual live trades and positions. Our trading guides bring our DailyFX Quarterly Forecasts and our Top Trading Opportunities; and our real-time news feed has intra-day interactions from the DailyFX team. And if you’re looking for real-time analysis, our DailyFX Webinars offer numerous sessions each week in which you can see how and why we’re looking at what we’re looking at.
If you’re looking for educational information, our New to FX guide is there to help new(er) traders while our Traits of Successful Traders research is built to help sharpen the skill set by focusing on risk and trade management.
--- Written by James Stanley, Strategist for DailyFX.com
Contact and follow James on Twitter: @JStanleyFX