


In this webinar, we looked at setups in the FX market using the US Dollar as a medium. We employed price action in the effort of discerning setups in trends across USD, specifically focusing on EUR/USD, GBP/USD, USD/JPY, USD/CHF, USD/CAD and NZD/USD. Of particular interest are the setups in both DXY (the US Dollar) and EUR/USD; each of which have a valid case to be made on either side. We also looked at US equity indices after an aggressively bullish post-NFP scenario has developed. This keeps the prospect of ‘risk on’ across global markets, and this can be followed in FX with weakness in the Japanese Yen.
Talking Points:
- If you’re looking to improve your trading approach, our Traits of Successful Traders research could help. This is based on research derived from actual results from real traders, and this is available to any trader completely free-of-charge.
- If you’re looking for a primer on the FX market, we can help. To get a ground-up explanation behind the Forex market, please click here to access our New to FX Trading Guide.
If you’d like to sign up for our webinars, we host an event on Tuesday and Thursday, each of which can be accessed from the below links:
Tuesday: Tuesday, 1PM ET
Thursday: Thursday 1PM ET
US Dollar’s Q3 Pullback Finds Strength – But Can it Last?
We asked this same question earlier this morning and the answer thus far has been ‘no,’ as the US Dollar has continued to slide after yesterday’s bullish rip. As we looked at earlier, that bullish bounce equated to an approximate 38.2% Fibonacci retracement of the prior week’s sell-off; and resistance came-in around that level to push USD right back down to the key support zone that we’ve been following that runs from 94.20-94.30. The bearish case for DXY would be looking intermediate-term from the four-hour chart, plotting this morning’s resistance infection at the 38.2% retracement for a re-test of the lows at 93.71. The shorter-term case could be bullish in nature, looking for higher-low support to hold above yesterday’s swing-lows of 94.08 or 94.02.
US Dollar Four-Hour Price Chart: Can Cut Both Ways, a Case on Either Side
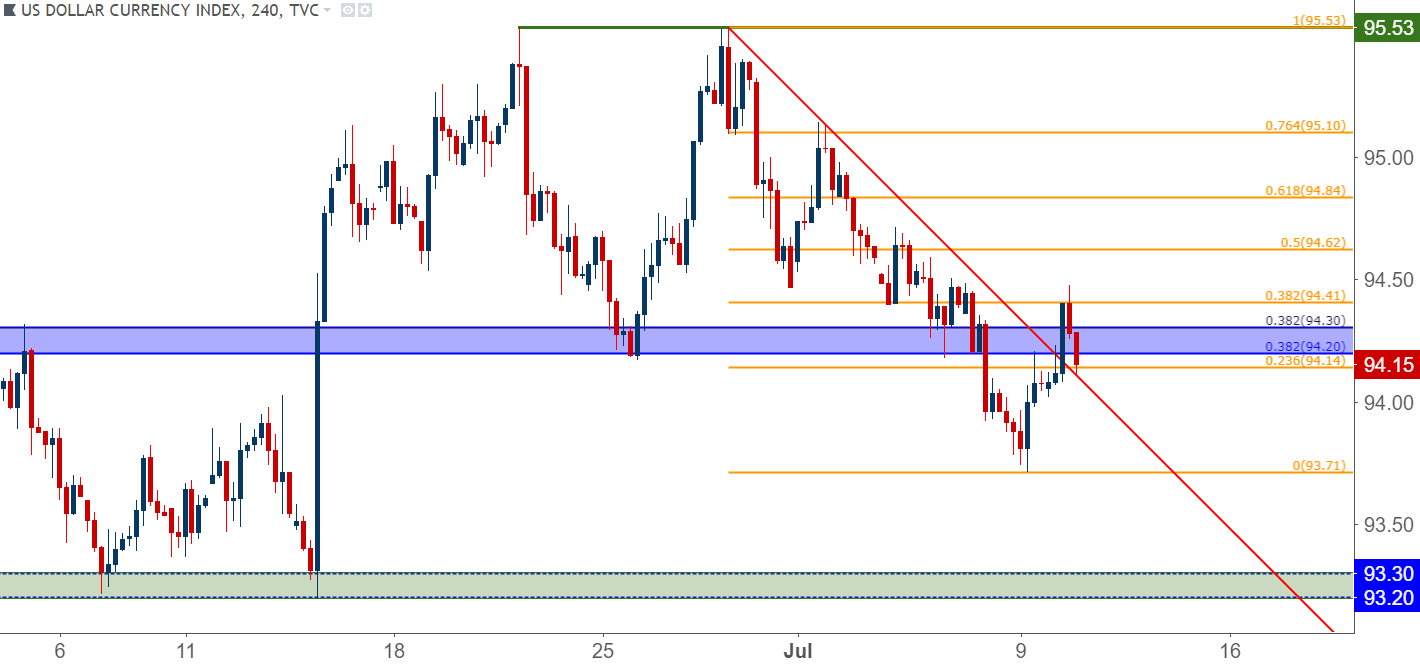
Chart prepared by James Stanley
EUR/USD Re-Tests Key Zone for Support
We looked at the prospect of bullish reversals in the Euro last week, and the long side of EUR/USD was one of our FX Setups for This Week. The context for the setup is a big zone of support/resistance that runs from 1.1685-1.1736. This zone has been in play since August of last year, furnishing multiple examples of support followed by a few iterations of resistance. More recently, prices re-engaged above this zone, and given the pace of last week’s gains, the door was opened for a deeper bullish move. Similar to the US Dollar, however, the shorter-term variant of EUR/USD price action could allow for moves in the other direction, looking for weakness to show-up after last week’s strength.
EUR/USD Four-Hour Price Chart: Re-Claiming Key Support Zone 1.1685-1.1736
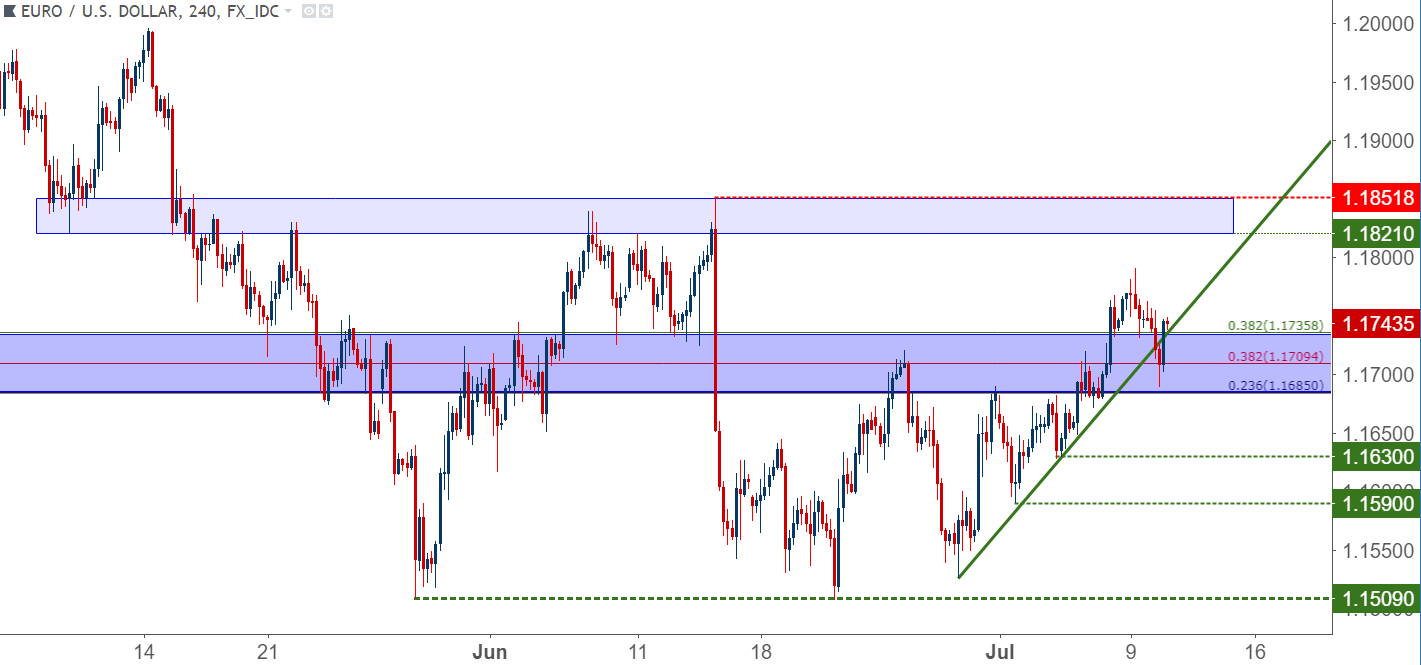
Chart prepared by James Stanley
GBP/USD Gets Messy as Political Risk Takes Center Stage
The economic argument for a stronger Pound is rather solid. The BoE had three dissenting votes for a rate hike at their last meeting; and considering that this wasn’t a ‘Super Thursday’ rate decision and yet still three members voted for an immediate rate hike – that’s notable. On the other side of the trade, however, we have a rather opaque political pressure that could potentially worsen in the days or perhaps weeks ahead. Time is ticking down to the EU-UK showdown (set for October), and the backdrop may not be opportune for a rate hike from the BoE ahead of that meeting. Meaning we may be waiting until November for any possible rate hikes out of the BoE. This doesn’t necessarily obviate the bullish case, but it does make it a little less time sensitive while also bringing further focus on near-term volatility in British Politics. I’m steering clear until this cleans up.
GBP/USD Four-Hour Price Chart: Messy with an Overall Bearish Bias

Chart prepared by James Stanley
USD/CHF Remains Attractive for Short-USD Strategies
While many pairs are gearing up with USD-strength setups, USD/CHF remains attractive for the other side of the Greenback. While the Dollar has been rather strong over the past couple of months, USD/CHF has continued to put in lower-highs after the failure to hold parity. We were building into a symmetrical wedge that started to give way on the short-side, but that move wasn’t able to continue. The door remains open for bearish positions; but the primary challenge at this point is one of risk-reward at current levels.
USD/CHF Four-Hour Price Chart: Slip Below Parity Brings Bearish Appeal
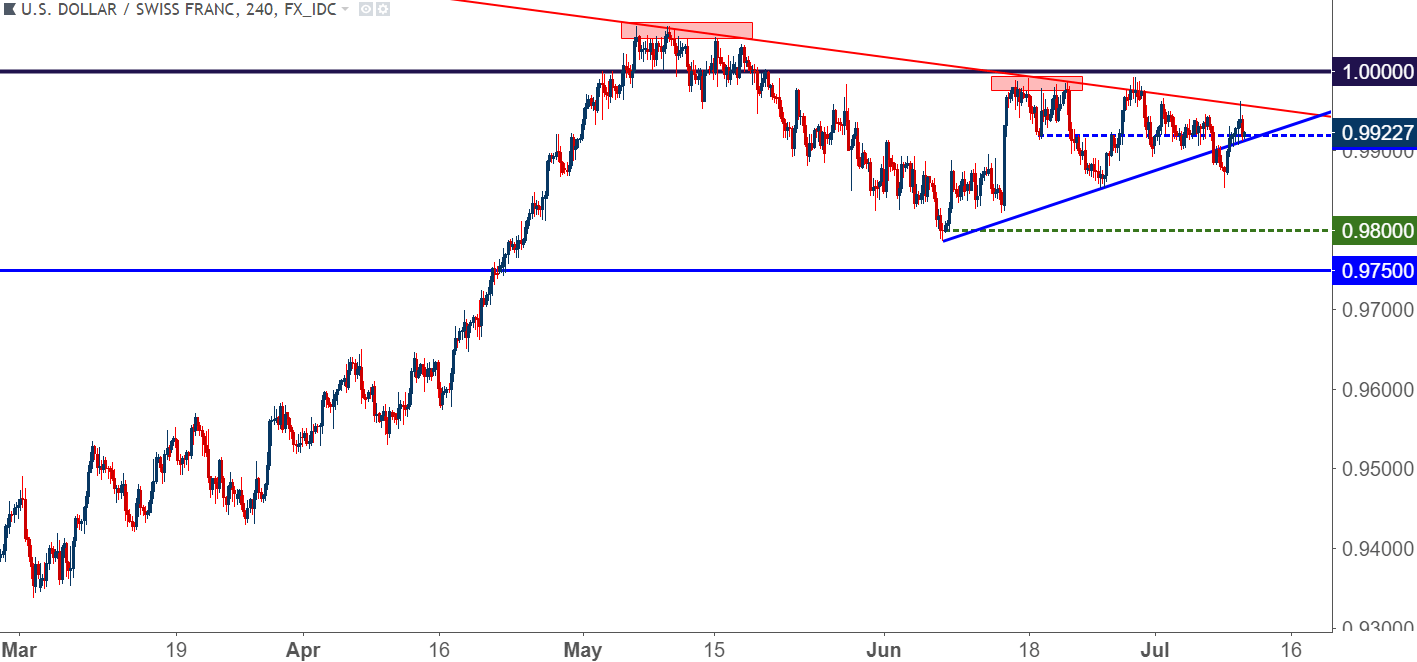
Chart prepared by James Stanley
USD/JPY Nearing Bullish Breakout
We had looked at the prospect of Yen-weakness as one of our price action themes for Q3, and that’s largely played out so far. USD/JPY is bucking up against the five-month high, which also happens to take place at the 76.4% retracement of the 2018 major move. As we looked at on shorter-term charts, bulls are getting increasingly impatient, as evidenced by the higher-lows that have been continually driving back to that resistance. This opens the door for bullish breakout potential in the pair, looking for a break above the 111.50 level to lead to further higher-highs.
USD/JPY Daily Price Chart: Testing a Big Level of Resistance

Chart prepared by James Stanley
USD/CAD Bounce From Confluent Support Ahead of BoC
Tomorrow brings a Bank of Canada rate decision, and a hike is very much expected here as the BoC has been laying that groundwork for some time. The bigger question is what’s next? Will the BoC be able to start looking at another hike while the topic of tariffs and trade wars remains as a headline risk? Or will they try to absorb this next 25 basis points of adjustment before plotting their next move? Whatever the result, USD/CAD has bounced from a key support area that we had looked at last week and included as one of this week’s FX Setups. The area of 1.3065 was confluent support, and a bounce from this level opened for bullish continuation. The big question now is whether this area holds through tomorrow’s rate decision.
USD/CAD Four-Hour Price Chart: Bounce From Confluent Support Ahead of BoC

Chart prepared by James Stanley
NZD/USD Resistance at Prior Range Support
We followed the two-year range in NZD/USD quite heavily over the past few months; until it started to breakdown, at least. That breakdown happened in June, and prices ran down to fresh two-year lows shortly after. At this point, price action has bounced back into that prior area of support, and yesterday produced a Doji. We looked at how an evening star pattern could re-open the door for bearish exposure in the pair, but the third bar looked suspect for that to fill-in. We instead looked at how we could approach the matter should today’s candle close as it was currently showing, as a second consecutive doji.
Bullish Strategies in US Stocks
Probably one of the more visible takeaways from Friday’s NFP report was the show of strength across US stocks in the aftermath. While the first half of the year brought questions to the prospect of continuation across US equities, Q3 started off in a very bullish manner, aided in part by last Friday’s Non-Farm Payrolls report.
The S&P 500 moved up to test the four-month high earlier this morning, and the door can be opened to bullish breakout strategies here. On the other side, the move in the Dow Jones has been less pronounced, and this can be traded with ‘inside price action,’ looking for prices to scale back to prior areas of interest to open the door for topside strategies.
To read more:
Are you looking for longer-term analysis on the U.S. Dollar? Our DailyFX Forecasts for Q1 have a section for each major currency, and we also offer a plethora of resources on USD-pairs such as EUR/USD, GBP/USD, USD/JPY, AUD/USD. Traders can also stay up with near-term positioning via our IG Client Sentiment Indicator.
Forex Trading Resources
DailyFX offers a plethora of tools, indicators and resources to help traders. For those looking for trading ideas, our IG Client Sentiment shows the positioning of retail traders with actual live trades and positions. Our trading guides bring our DailyFX Quarterly Forecasts and our Top Trading Opportunities; and our real-time news feed has intra-day interactions from the DailyFX team. And if you’re looking for real-time analysis, our DailyFX Webinars offer numerous sessions each week in which you can see how and why we’re looking at what we’re looking at.
If you’re looking for educational information, our New to FX guide is there to help new(er) traders while our Traits of Successful Traders research is built to help sharpen the skill set by focusing on risk and trade management.
--- Written by James Stanley, Strategist for DailyFX.com
Contact and follow James on Twitter: @JStanleyFX


