


SPDR S&P 500 ETF, Nasdaq 100, VIX and USDJPY Talking Points
- Historically, these final weeks of the year experience a predictable slide in volume and volatility that translates into the norms of the Santa Rally
- Despite expectations, we continue to see serious pressure on risk-leaning assets that may tax market calm – though unexpected volatility does not necessarily mean out-of-season trends
- My threat assessment to break market calm certainly includes systemic themes like omicron, but it is technical support on the S&P 500 and Nasdaq 100 which is my top milestone

The Very Unseasonable Risk Conditions
Normally, the markets are set to cruise control in the lead up to Christmas vacation as the historical norms of thin liquidity tends to lead to a self-fulfilling prophecy of low volatility and slow speculative build into the new trading year. However, the break from tradition that we have seen through the first half of the month and even back in November seems to be carrying troublingly forward. Volatility is game changer in a market and seasonality has little capacity to fend off the unexpected risks if a heightened state of anxiety cannot be shaken. The risk of an ‘accident’ rose significantly to start this week with a significant drop in ‘risk’ assets that seemed to span region and asset type. While breadth is perhaps the most important aspect of gauging intent and capacity for a trend, I am looking for a practical tipping point. For me, that seems to be the imminent support from the S&P 500 and Nasdaq 100. Both are facing 100-day moving averages, range support and in the former’s case the post-pandemic bull trend floor. Should 4,500 or 15,500 give way. I’ll be watching the markets rather than holiday movies.
| Change in | Longs | Shorts | OI |
| Daily | 1% | -1% | 0% |
| Weekly | 15% | -13% | -1% |
Chart SPDR S&P 500 ETF with 100-Day SMA, Volume and Opening Gaps (Daily)
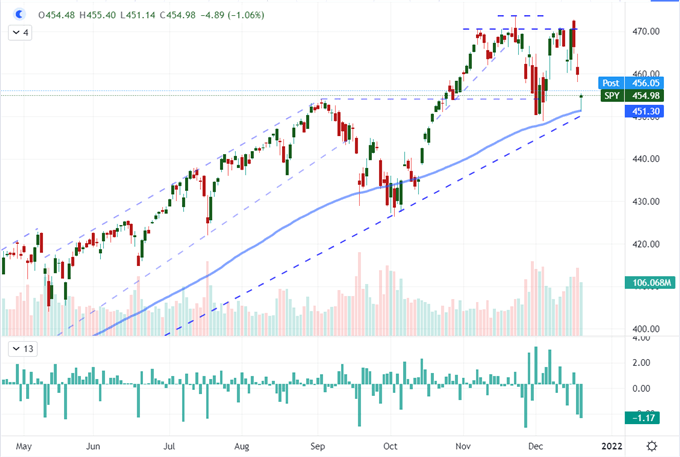
Chart Created on Tradingview Platform
While volatility has been higher than I would have thought feasible even with surprising event risk (FOMC hawkish shift last week) and the evolution of open-ended risks (such as omicron and Evergrande), I still believe the most probable course through week’s end is a fade in market depth and tempo. If that is indeed the case, these technical floors will serve as a good spring board for a swing back into range. While not all major global indices and alternative measures of risk are facing as clean a technical milestone as the more active US indices, there are the same sense of potential for reversal. That said, probability and potential need to be considered in tandem. Even though the statistics suggest a reversion to a mean is likely to take place, such a course is relatively restrained compared to the severe impact of a not-so-unexpected alternative. Among the various assets I am watching for exposure to risk aversion, assets like emerging markets are more heavily discounted and commodities have supply-demand inflation influences. It’s equities that stands out to me as the most at-risk.
Chart of Risk Asset 12-Month Relative Performance (Daily)
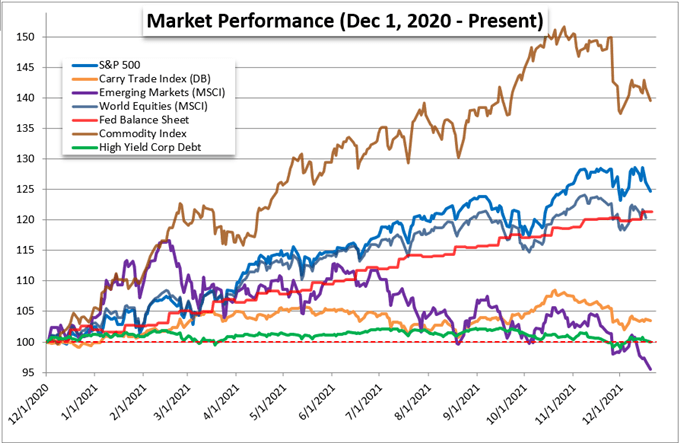
Chart Created on Tradingview Platform
‘Tis the Season…Right?
Taking a closer look at the seasonality statistics, the natural slide into year end follows a very routine structure. The 50th week of the year (last week) typically hosts the last run of high profile event risk before Christmas conditions set in and is frequently the time frame for the often controversial last FOMC rate decision of the year. To see a jump through that time frame is not a stretch. However, even the modest uptick in the implied activity measures don’t do justice to the ‘realized’ measures of activity. In fact, the S&P 500 – which the VIX is derived from – has seen its 20-day ATR charges to 1.6 percent of current spot which is the highest level of activity in 9 months. Averages host extremes, and we could very well see one of those outliers this year if conditions persist.
Average Weekly VIX Performance by Calendar Week
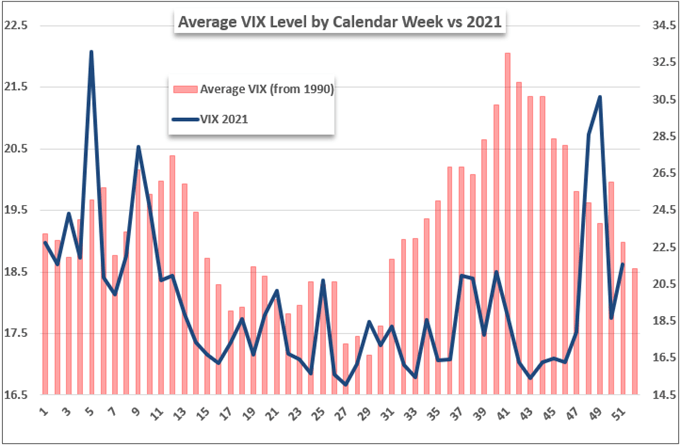
Chart Created by John Kicklighter with Data from S&P 500
In a similar vein to the activity level, the measures around risk trends holds a similar deviation to historical norms. The slide from the S&P 500 this past week is about the only typical performance we find from the averaged numbers from previous years. The tumble through the 49th week defied convention in a serious way. Thus far, we are start the week underwater which is very different than what history has shown of a 51st week for the index’s returns. If things prove any worse on the scope of discrepancy though, we are looking at a possible technical breakdown which can fuel a serious escalation of troubles ahead.
Average Weekly S&P 500 Performance by Calendar Week
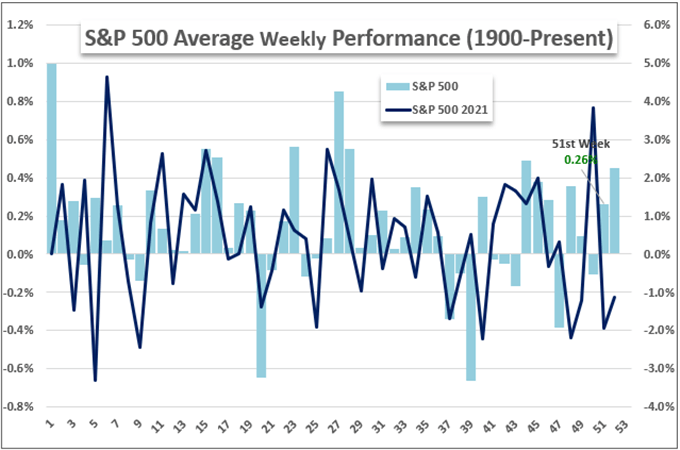
Chart Created by John Kicklighter with Data from S&P 500
What to Watch for as Catalysts and Non-Index Impact
When it comes to overriding liquidity-led constraints around holiday trading periods, I usually place the greatest emphasis on market signaling on the price considerations of those benchmarks most in command of the speculative extreme. That means suppressing my desire to find a ‘reason’ for a meaningful move via a fundamental charge and curbing my interest in alternative market benchmarks which could offer greater context to intent. That said, one of the most interesting measures of risk, sentiment or fear – depending on your perspective – is USDJPY. This is by no means the most sensitive speculative measure to every rise and fall in conviction. Instead, it is a more tuned instrument as the Dollar is a safe haven in its most traditional sense the same as the Japanese Yen. It’s carry trade appeal build up has complicated the relationship between the two currencies, but that helps to determine whether the ebb and flow in speculative interest is tepid or committed. If the Dollar is gaining for this pair during a period of risk aversion in other words, it is likely a very serious financial situation or liquidity is otherwise severely low.
Chart of USDJPY with 100-Day SMA (Daily)
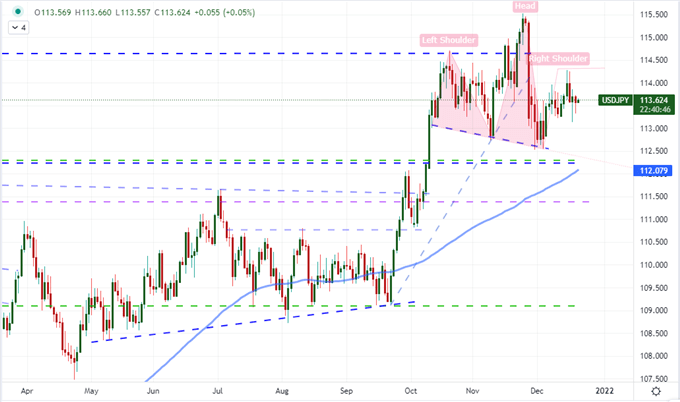
Chart Created on Tradingview Platform
While my focus through the immediate future is on market response and performance given all the abnormalities in liquidity, I have a personal need to always determine what the principal driver is the masses in making the collective decision for bearing. It may be a temporary control over perspective, but very often the leading motivation can continue to exact influence for some time. Looking to global search interests in financial circles according to Google Trends, we can see that there are a few macro matters that are humming with the threat of sudden resurgence. As it stands, the general interest in China is once again top of my list by atrophy in the other matters. The country represents a lot for international finance and economic consideration, but I am watching for the purposes of Evergrande and global trade relations. The second most pressing matter is the uncertainty around the omicron variant of the coronavirus which is still pushing caseloads higher and represents a disproportionate risk that can pinch growth with little warning. As for the Fed, the US central bank’s policy shift was a surprise last week, but the market seems to have adapted quickly. On the stimulus side, the focus is fiscal with the Build Back Better program suddenly thrown into disarray by Senator Manchin.
Chart of Key Google Trend Search Interest for ‘China’, ‘Stimulus’, ‘Omicron’ and ‘Fed’ (Daily)
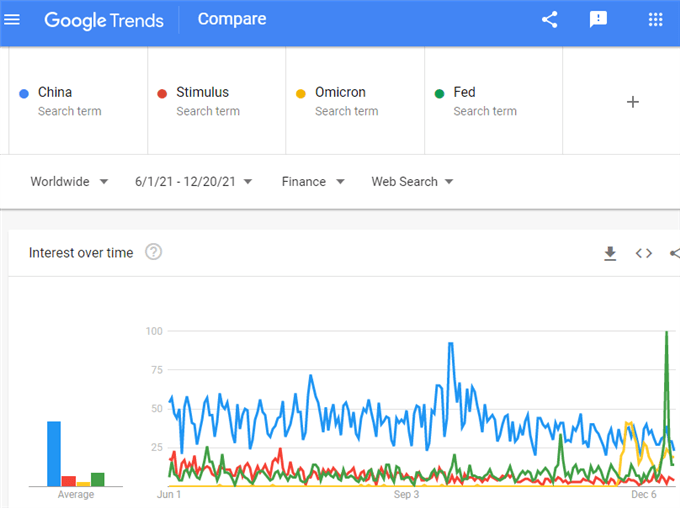
Chart Made on trends.google.com


