SPDR S&P 500 ETF, Nasdaq 100, VIX and Monetary Policy Talking Points
- The S&P 500 completed a volatile range swing to end this past week, but the index clearly lacks for an explicit bearing
- In a mirror to the S&P 500, the Dollar’s rally has pushed the upper boundary of its own multi-week range without committing to a clear trend
- While there is some notable event risk and open-ended themes like monetary policy ahead, the name of the game is liquidity until the new year


Risk Trends Turn Topsy-Turvy
There are still two weeks until we completely wind down 2021; but that doesn’t mean we should look upon the capital market benchmarks for typical, medium-term developments based on systemic fundamental themes or straight forward technical patterns. In fact, everything month into these two final weeks of the year will be seriously upended given the conditions we are dealing with naturally into the wind down. On the speculative extreme, we closed out the past period to significant pressure. While there was contrast from the likes of the Dow and Russell 2000, the US indices were distinctly represented by the S&P 500. After failing to secure a break to record highs in aftermath of the FOMC decision this past week, the benchmark index extended its retreat to a -1.9 percent tumble on the fourth technical drop in a short five-day performance. Despite that pressure, we have yet to earn a genuine technical breakdown in a very mature bull trend. That is remarkable given the persistent activity levels (ATR) that noticeably contradicts the tight historical. Can we see a break in these twilight liquidity hours?
| Change in | Longs | Shorts | OI |
| Daily | 1% | -1% | 0% |
| Weekly | 15% | -13% | -1% |
Chart SPDR S&P 500 ETF with 20 and 100-Day SMAs with Volume (Daily)
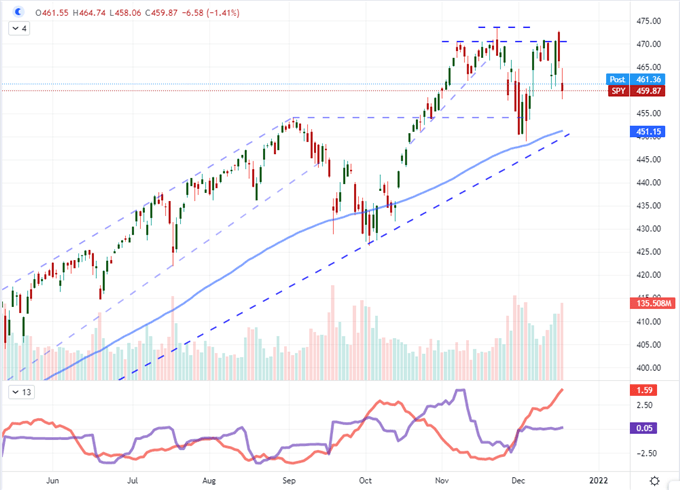
Chart Created on Tradingview Platform
While I’m watching the range develop for the likes of the S&P 500 and the Dow Jones Industrial Average, my attention is still trained on the signs showing appetite for momentum. There are no serious outliers of liquid speculative appetite, and we don’t necessarily need such distractions. While there is a technical appeal and fundamental story behind the likes of DAX, carry trades, emerging market and Treasury yields among other sensitive measures; the same story arises: de-risking of various duration into the known liquidity drain of the year-end. At the more honed end of the risk spectrum, the drive around favorite speculative benchmarks like the tech-heavy index relative to the ‘value’ oriented Dow experienced a sharp reversal these past weeks from a record high. We are the verge of a more systemic reversal according to the charge, but pulling down exaggerated risk is not easy to do in the environment we find ourselves.
Chart of Nasdaq 100 to Dow Jones Ratio (Daily)
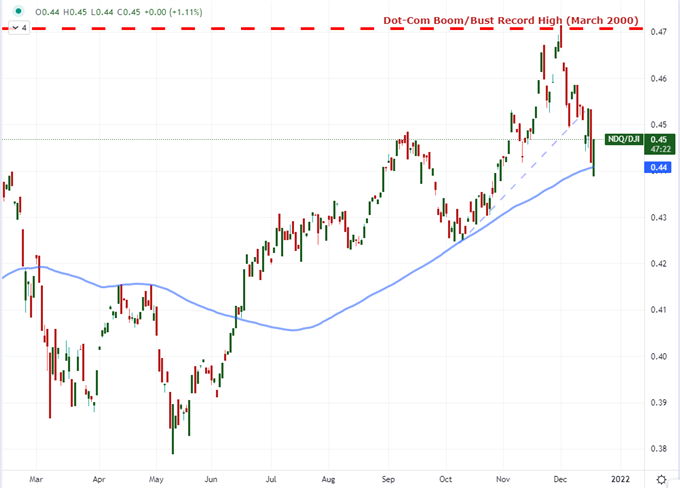
Chart Created on Tradingview Platform
In general, I’m very interested in the technical patterns yet resolved on major markets; but I know that committing to a clear break and productive trend from here on out is very impractical. Aside from the recent evidence of noncommittal from benchmarks, we have the deep seasonal expectations to draw from in setting trade expectations. When it comes to activity level, history shows that the 51st week of the year (which we are heading into) averages a significant step down in activity from the previous period. That should not be a surprise at all given the rush of event risk that would naturally precede the Christmas holiday drain. With a slide in activity typically comes a drop in liquidity (or vice versa), but traders would do well to monitor the clip of turnover when establishing the practicality of their trade setups should they last anything more than a session or less than a month.
Average Weekly VIX Performance by Calendar Week
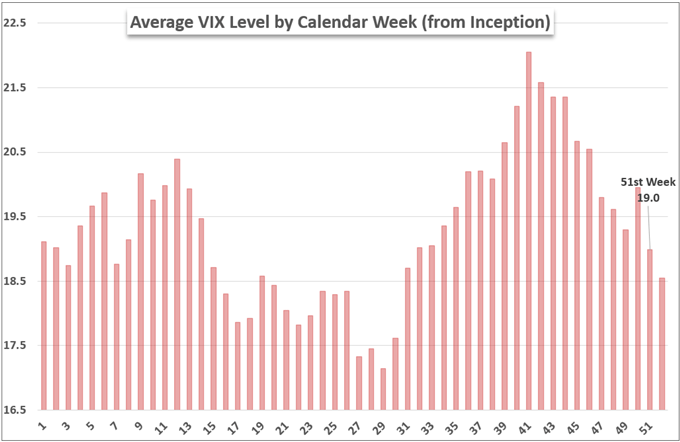
Chart Created by John Kicklighter with Data from S&P 500
Similar to the expectations associated to volatility expected from the second-to-last week of the year, the historical performance of capital market benchmarks like the S&P 500 follows a very well-laid out script. True to form, the SPX suffered a loss through this past week (-1.9 percent) that seems to align to the long-term averages that reflects the last full event risk of the year as well as the last gasp of intent from medium-term swing traders before holiday trade takes over. It is very likely that the expectations surrounding Christmas trade set in over the coming week, which can seriously undermine trends of intent. That said, errant bouts of volatility exacerbated by thin trading conditions should be considered reasonable pitfalls through end-of December.
Average Weekly S&P 500 Performance by Calendar Week
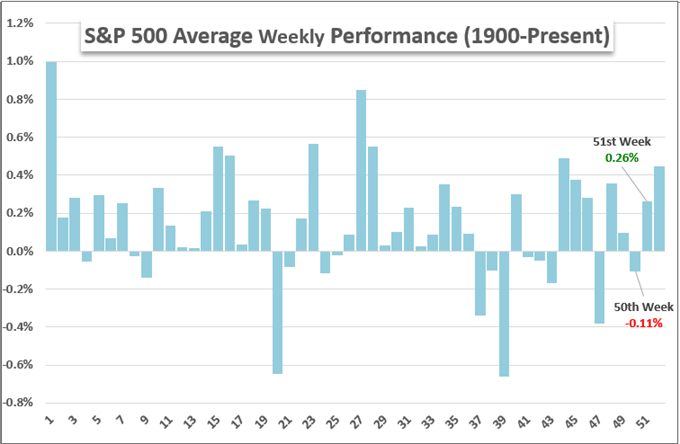
Chart Created by John Kicklighter with Data from S&P 500
Similar to the situation in traditional risk assets, the US Dollar has found volatility without technical resolution; and it is unlikely to find outs guiding light before year’s end. There is a tight range on the Greenback (DXY trade-weighted index), which faces a high probability of breakout before we wind down the clock on the trading year. However, follow through is a very different concept. The maintenance of a month-long range at the highest range in years looks like a prime candidate for markets to tip into a systemic favorite, but even a hawkish Fed prospect is not a natural lift for an already bullish corner of the market.
Chart of DXY Dollar Index with 100-Day SMA, 20-Day ATR and Range Overlaid with US 2-Year (Daily)
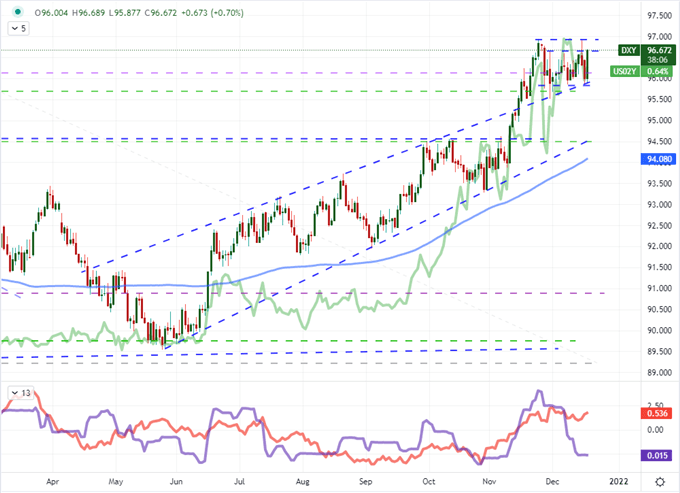
Chart Created on Tradingview Platform
If there is a technical progress to be expected over the coming two weeks, I don’t see much in the way of fundamental motivation to urge the matter along. Scheduled event risk is particularly curbed; but if push comes to show, the US PCE deflator – the Fed’s favorite inflation indicator – would be at the top my watch list. More capable of serious influence in the liquidity-distorted conditions ahead are the abstract and unresolved risks ahead. Monetary policy in general remains a point of contention. It is worth recounting the unmistakable shift in global monetary policy over this past month as a charge for relative yield appeal but also a signal that the seemingly bottomless central bank support does indeed has its limit. Otherwise, my belief in any sudden market catalyst rests with the more abstract matters such as the rise in rise in omicron cases in the US and globally or the path forward after Standard & Poor’s announcing itself to be the last major rating agency to move China’s Evergrande to a selective default status.
Chart of Relative Monetary Policy Stance
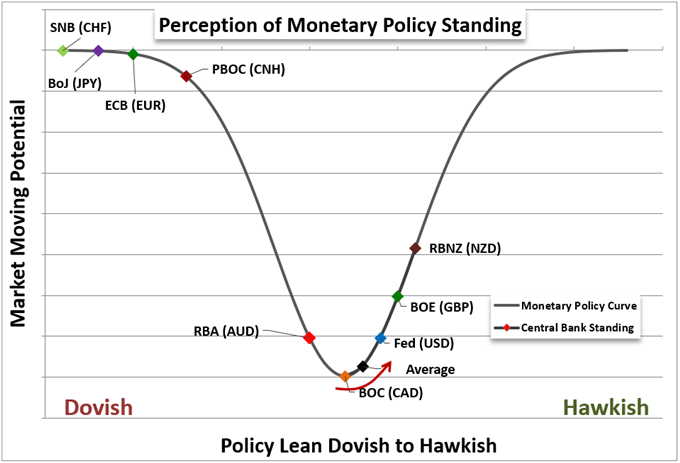
Chart Made by John Kicklighter


