


Dow, S&P 500, VIX, Dollar, GBPUSD and GBPCAD Talking Points:
- The headlines reported a record high S&P 500 and Nasdaq Monday, but the Dow’s struggle suggests a more concentrated speculative appetite
- Liquidity and volatility are exacerbated by the anticipation of Wednesday’s FOMC rate decision with the smallest 40-day SPX range in years and a sharp intraday rally
- Despite a retreat from Gold and US 10-Year yields, the Dollar has held up going into Tuesday trade – with the smallest daily range since Feb 2020
The Evidence of Anticipation Isn’t Necessarily a Dead Market
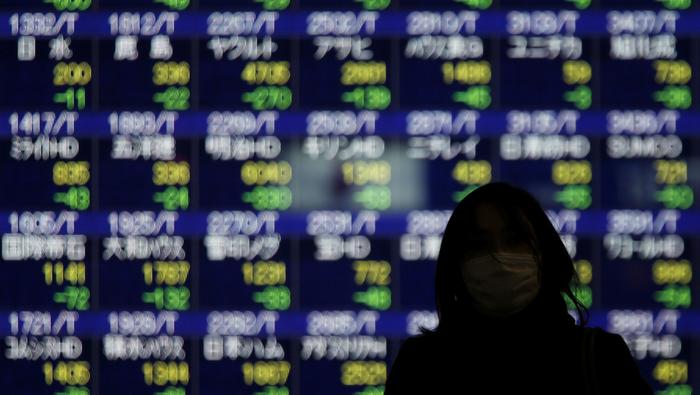
When heading into an even that can upend speculative sentiment across the entire financial system, it is reasonable to expect a significant distortion in market conditions. We are seeing just such a warp in the various markets I tend to follow leading into the Wednesday’s FOMC rate decision. Given the potential impact of the event, you could expect that the market would simply grind to a halt. What market participant would want to significant add to or change their exposure so close to an event that could abruptly change both the market’s direction and tempo? The notion makes sense, but in practice there are additional dimensions to the kind of market activity we actually see. Certainly the risk of a heavy impact from the Fed decision exists, but not everyone is going to be sidelined waiting for the event. Some intend to make moves that play out before the decision hits, others believe they know what outcome will play out and then there are those that simply don’t pay heed to such events. This hodgepodge is unlikely to fill the markets out such that we can generate trends, but it can absolutely generate volatile as thinned market conditions can amplify bold moves. One such indication of this kind of speculative skew is the disparity in performance between risk measures that are considered ‘value’ versus those that are more explicitly trader targets. The Dow’s slide Monday to contrast the S&P 500’s and Nasdaq 100’s record highs speaks to this.

Chart of the S&P 500 ETF Overlaid with 20 and 100-DMA with Volume (Daily)
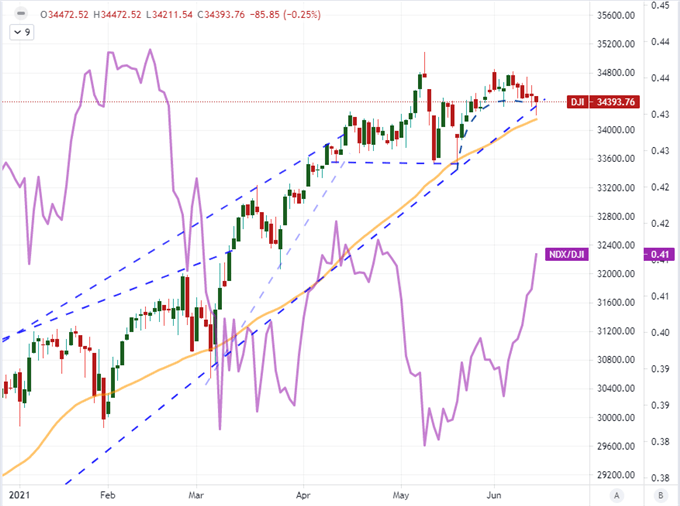
Chart Created on Tradingview Platform
Looking more closely at the opening trade session’s backdrop conditions, we bore witness to a strong amplification of intraday volatility. Through much of the active New York session this past trading day, the S&P 500 was under pressure. It wasn’t the kind of slide that would stoke genuine fear that a fire sale was a possible scenario, but it certainly raised threat awareness among short-term traders – that is until the final stretch of trade before the exchanges closed. In the span of just over half an hour, the active emini futures contract 19 ‘handles’ to position the index for a record high close. For those that only registered the day-over-day close, the impression was very different than those watching price action intraday. This should serve as a reminder: expect thinned markets hopped up on anxiety to be dangerous ground.
Chart of the S&P 500 Emini Futures Active Contract with 20-Period MA (15 Min)
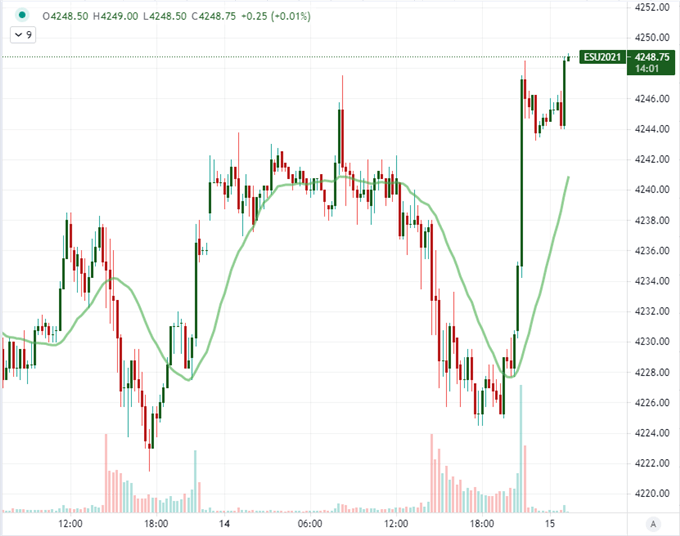
Chart Created on Tradingview Platform
Keeping the Focus On What’s Ahead
There its quite a bit of event risk on the docket over the next 24 hours. However, how much market moving potential is there in updates like the US retail sales, factory inflation or industrial production knowing the Federal Reserve can significantly alter anticipation with just a few words or the shift of the dot plot? I will certainly keep close tabs on the meaningful indicators ahead of us; but for the next 36 hours, the context will be ‘what can this do to the FOMC boards interpretation of necessary actions’? After the rate decision, the data will fit a less contrived interpretation of how the economy is faring. I will hold off a full run through of the scenarios that I suspect the Fed will wrestle with tomorrow. That said, I will include the table I’m working with below.
Chart of FOMC Scenarios
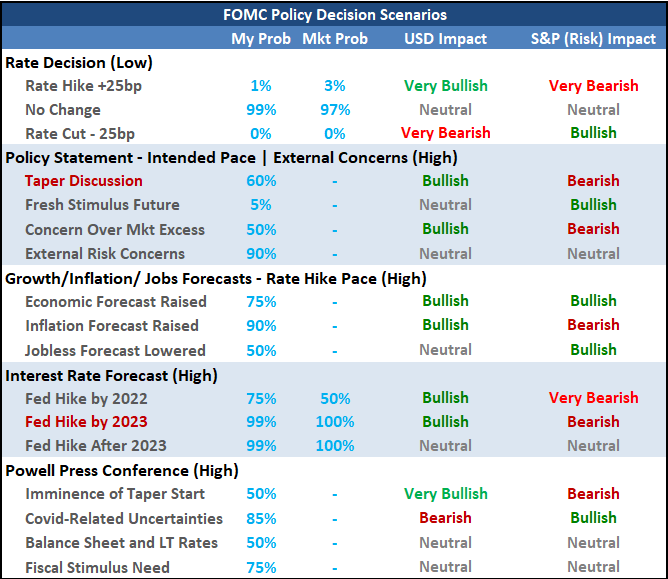
Table Made by John Kicklighter
Another consideration of data leading into a much more prolific event – not just the Fed – is that relevant updates before the detonation does not necessarily have to set off an avalanche of chaotic or productive repositioning. Point in case was last week’s CPI release for the previous month. The headline figure accelerated to a 2008 high and the core reading stretched to a level not seen in decades. That seriously contends with the central bank’s reassurances that price pressures are transitory. Nevertheless, the market continued to trade as if the fundamental waters were calm. If that was what we saw from the official inflation report last week, the impact from the New York Fed’s consumer inflation expectation survey this past session would be an even higher hurdle. Indeed, the expectations over the next year and three years were significantly higher, but the Dollar was barely budged.
Chart of Consumer Inflation Expectations from the New York Fed’s Survey (Monthly)
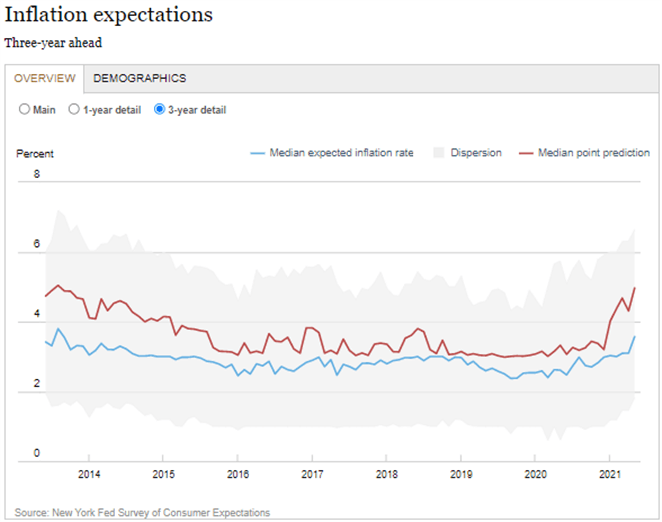
Chart from the New York Fed’s Survey of Consumer Expectations
In fact, the Greenback was so restricted that the trade-weighted DXY Dollar Index carved out its smallest daily range (excluding Jan 1) since back in February 2020 – before the pandemic struck. Sure, there is a Fed decision less than two days away, but the benchmark Dollar made a technical attempt to once again reversal a multi-month bear trend and bullish progress would move the currency back into a larger, established range. Not everything was anchored however. Gold suffered a noteworthy bearish break through the early trading hours Monday. It recovered some of its lost ground in the New York afternoon, but the channel break from the past few months was made. Further, the US 10-Year Treasury yield continued to trade with significant volatility – this time manifesting in a short-term bullish reversal from last week’s slide.
Chart of DXY Dollar Index with 20, 50 and 100-DMAs and 1-Day Historical Range (Daily)
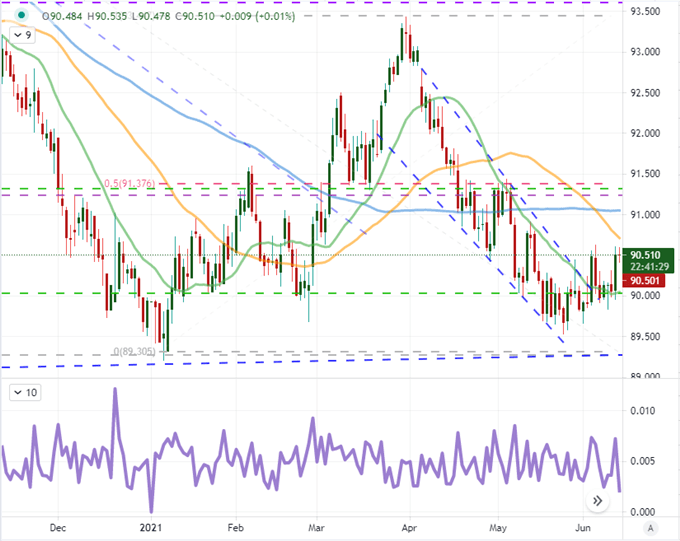
Chart Created on Tradingview Platform
Is It Possible to Avoid the Pull of the Fed’s Expectations?
There are some very interesting technical patterns and backdrop fundamental themes that are unfolding for a range of Dollar-based majors and US capital market benchmarks, but the practicality of follow through on these beset assets seriously strains credulity. It is possible that you can take a view on such a market and the outcome of the mid-week statement could support your view; but that is not reasonably playing the probabilities. An example of where temptation is drawing me is GBPUSD. The pair has carved out a head-and-shoulders pattern which stands immediately below the midpoint of the 2014-2020 range while lower there is a post-pandemic bull trend support aligning to the 50-day moving average at 1.4000. This looks loaded, but Wednesday is at least an encumbrance to progress if not ultimately the deciding factor.

Chart GBPUSD with 50 and 100-DMAs and 30-Day Historical Range and ATR (Daily)
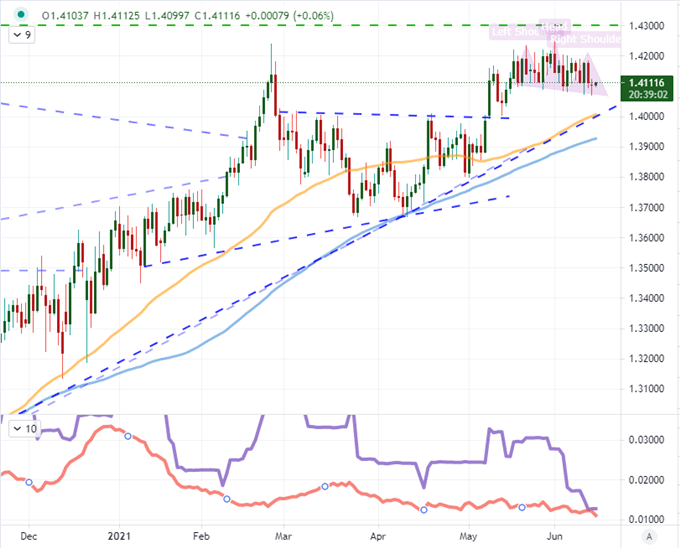
Chart Created on Tradingview Platform
In general, I think the Sterling has more potential than just what the Cable has to offer. Bank of England Governor Bailey was speaking to open the week and one of the topics he touched upon was the trouble of navigating such a large stimulus program as the one the MPC is directing if he looks out over a 5 year horizon. He likely picked such a distant timeline to dampen what is essentially a soften addressing of the need to eventually taper. That same view seems to be permeating the financial system with investor Paul Tudor Jones, Bank of America CEO Moynihan and JPMorgan CEO Dimon all suggesting the time for policy shift is nigh or market distortions could follow. To train in on the potential of the Pound, there are certainly EURGBP and GBPJPY to consider; but GBPCAD looks to be more interesting for influence from the counter-currency today. Canadian factory inflation and housing starts data is on tap. Don’t forget, the BOC actually tapered just over a month ago.
Chart of GBPCAD with 50 and 100-DMA with 30-Day Historical Range and ATR (Daily)
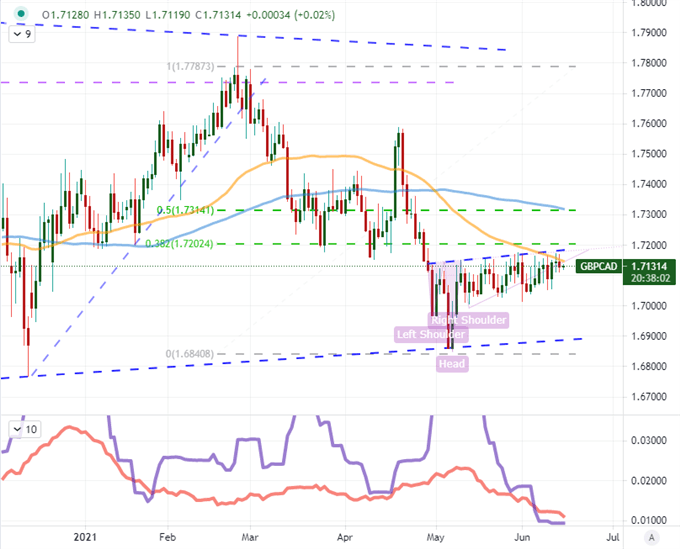
Chart Created on Tradingview Platform

.


