


S&P 500, Dollar, Tesla, Bitcoin, Inflation and Earnings Talking Points:
- The S&P 500 opened this week with a record high but the smallest daily range (as percentage of spot) since December 24th, 2019
- Earnings is the most prolific theme for the next 24 hours with key releases that will tap tech favorites, blue chip growth benchmarks and retail trading targets
- Dollar traders and global markets watchers alike would do well to focus on monetary policy – Fed over BOJ – as inflation expectations climb rapidly

The Calm Before the Storm
By all accounts, the opening session of the week was quiet for trading. There was little consistency across the measures I like to monitor as a web for ‘risk trends’ and even the typical pacers for speculative appetite were reticent to resort to the default advance that has become the custom of the past weeks. If we zoomed in, there was modest stronger gains to be registered for the Nasdaq 100 and the Russell 2000 relative to the S&P 500 and Dow, supporting the tech and small cap icons which tap into the appetite for momentum over ‘value’. However, it was the S&P 500 which registered a fresh record high close. But that milestone was earned through the smallest daily trading range (as a percentage of spot) since December 24th, 2019. While we are facing the effects of a confluence in seasonal and structural liquidity drain, this extreme is likely ‘normalize’ in the next 48 hours amid heavy event risk. The questions I have are: which direct the congestion breaks and how much follow through will we be able to muster?

Chart of S&P 500 with 100-Day Mov Avg and 10-Day ATR and Historical Range (Daily)
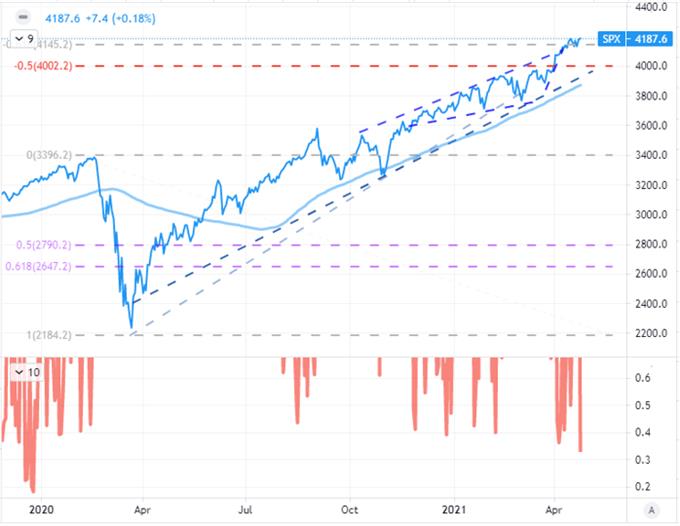
Chart Created on Tradingview Platform
While the curb in volatility and trend is particularly pronounced in the US indices, it isn’t the only restriction in activity. Global indices (German DAX, UK FTSE 100 and Japanese Nikkei 225), emerging markets (EEM), junk bonds, commodities with a risk lean and carry trade were all in the same boat. That is fitting if the attitude in the market is complacency compounded with the anticipation of a heavy fundamental docket ahead. However, the entire market isn’t stuck in this same holding pattern. A notable divergence was clear from the cryptocurrency market as the most liquid coin, Bitcoin and Ethereum, rebound by 10 and 9 percent respectively. The former is attempting to recover from a breakdown a few weeks ago, but the latter earned a new record high close. Despite the more favorable standing of ETH, Bitcoin was the bigger news item given electric car manufacturer Tesla booked a $101 million profit from its transactions in the cryptocurrency – in its quarterly report, perhaps papering over an otherwise underwhelming earnings.
Chart of Bitcoin Overlaid with Tesla (Daily)
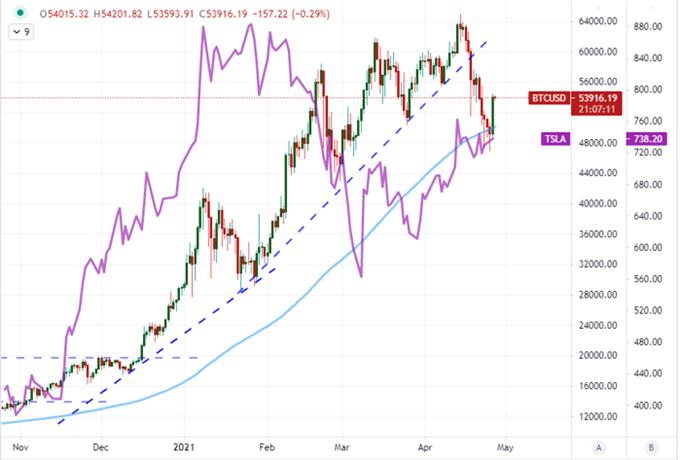
Chart Created on Tradingview Platform
Top Themes Ahead: Earnings and Monetary Policy
In a Twitter poll I conducted Monday, I asked those that would vote what they believe would be the most potent theme or event risk in market movement terms for this week. The options were: earnings; first quarter GDP readings; central bank meetings or ‘other’. The top listing was monetary policy meetings at 43 percent and second was earnings at 34 percent of the vote. Starting with earnings, the Tesla numbers after the close can carry weight into Tuesday opening trade. The willingness to overlook issues underlying the robustness of this ‘disruptor’s’ is a considerable litmus test. That said, the general theme picks up significantly in the upcoming session. Before the open, I will be watching UPS and General Electric figures as they are closer to growth via trade and blue chip economic activity; while MSCI and Invesco represent some of the products that speculative interests have chased during the retail swell during the opening months of the year (read Christopher Vecchio’s article on the rise in retail trading and what it may imply). After the close, we will get into the real meat of this week’s corporate reporting – the tech industry – anchored by Google and Microsoft.
Calendar of Key Macro Economic Events
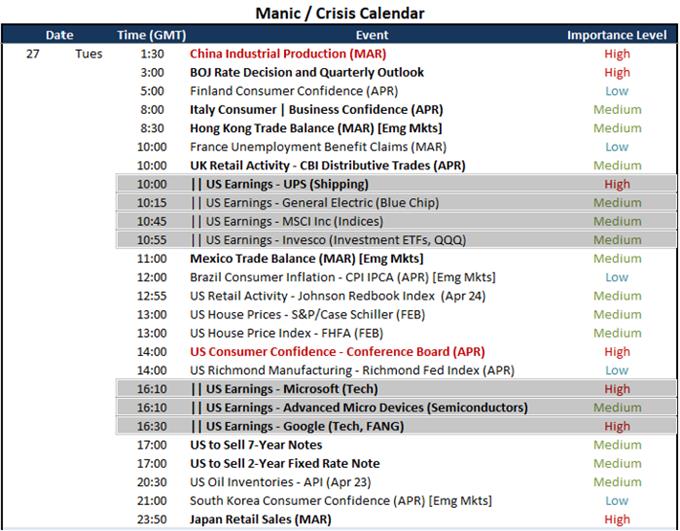
Created by John Kicklighter
Earnings will be a consistent fundamental matter through the rest of the week with notable updates through to the weekend. That said, I agree with the results of the aforementioned poll. I think the monetary policy events this week carry greater ‘risk’. The Bank of Japan held its benchmark rate unchanged at -0.10 percent while its yield curve control target has been kept at 0.0 percent as expected. The forecasts were more interesting with a cut to the core inflation outlook from 0.5 to 0.1 percent. It comes as no surprise that this central bank is not progressing towards its target as it has failed to achieve a consistent inflation target for decades now. Far more interesting is the Federal Reserve announcement due Wednesday. It is more likely that nothing changes at the end of the day, but the probability of a signal for normalization in the near future is growing quickly.
Graph of Relative Monetary Policy for Major Central Banks
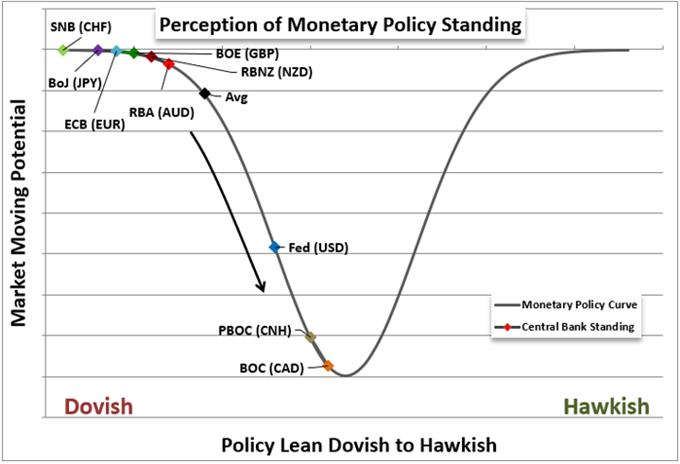
Graph Created by John Kicklighter
The Federal Open Market Committee’s last Summary of Economic Projections (SEP) issued last month held firm on the view that they did not expect to raise rates until at least 2023. That said, the market doesn’t see the path the same way. What’s more, the realization of the first rate hike is not the turning point of the market’s perspective around the dependency on external support. Before the first hike, we will see asset purchases reduced and start rolling off the balance sheet. And before that step, we should expect the policy group to have given us fair warning that such a step is on the menu. Operating on reasonable timelines meant to reduce the surprise and thereby volatility of the eventuality suggests we should expect that process to start 12 to 18 months before the first hike. We are closing in on that timeline if everything plays out as expected. That said, inflation pressures are not following the script. Commodity and upstream prices are building quickly while news outfits like the Financial Times is picking up on the mentions of cost pass on in earnings reports. If companies pass on the inflation, the timeline to hike could be moved up considerably.
Chart of Lumber, Crude, Copper, Wheat and Cotton Futures Prices (Daily)
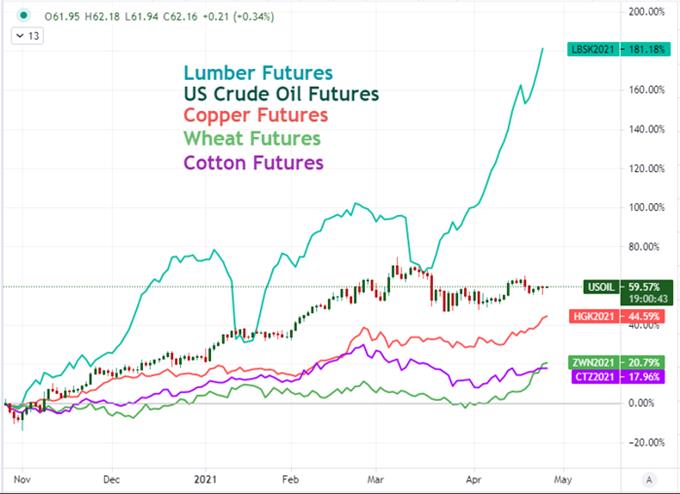
Chart Created on Tradingview Platform
Keeping My Eyes on the Dollar
While I’m of course interested in general risk trends moving forward and there have been some interesting developments for certain other regional currencies, the Greenback remains a focal point for me. The world’s most liquid currency carries a risk influence, is a carry candidate and sports one of the most impressive relative growth forecasts. There is a lot to motivate its development. That said, given the concentration of earnings on US firms, discussions of stimulus and taxes ongoing in Washington, not to mention the acute interest around the Fed event; there is a lot of pressure building up. That said, attempts at deciding a course before the cards are laid out should be eyed skeptically.

Chart of DXY Dollar Overlaid with Implied Fed Rates (Daily)
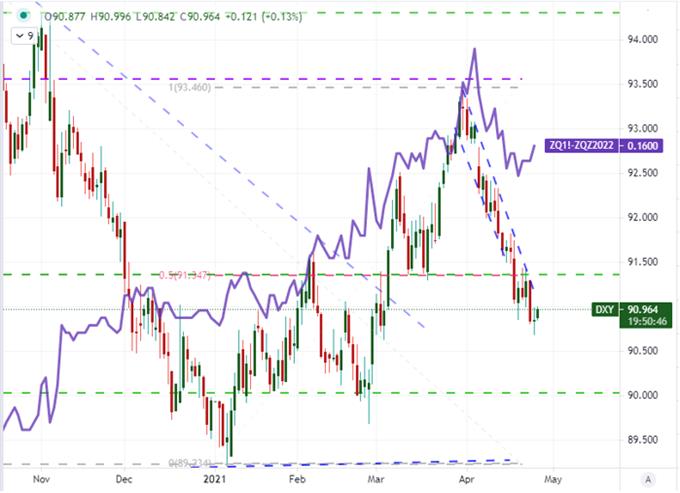
Chart Created on Tradingview Platform
Among the many Dollar crosses that one can follow, there is absolute utility in the likes of EURUSD while USDJPY’s Monday bounce after its bearish leg these past weeks remains a close focus of mine. At the more extreme end of the spectrum, USDTRY has pulled back from a double top at record highs. Yet, for the time being, I’m particularly interest in the Greenback’s pairing to the ‘comm bloc’. AUDUSD and NZDUSD bounced further into congestion that can be the ‘right shoulders’ of a head-and-shoulders pattern which has simply stalled out. USDCAD in the meantime has both shown a remarkable reversal of fortune all while returning to prevailing trend. From a false break above the upper bound of a year-long descending trend channel to extending that same stretch with a fresh three-year low, this is a pair that is holding to range and prevailing trend that suits assumptions.
Chart of USDCAD with 100-Day Moving Average (Daily)
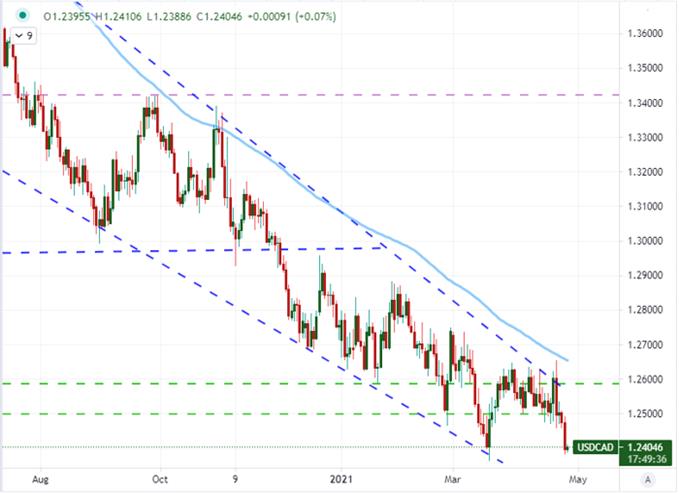
Chart Created on Tradingview Platform

.


