


Nasdaq, Dollar, Fed Fund Futures, Yields and Bitcoin Talking Points:
- The Russell 2000 lead a broad slide in US stock indices, but its 3.6 percent drop far outpaced its counterparts
- A Bank of America survey suggested fewer retail traders with stimulus checks were looking to put into the market but QQQs registered the biggest inflow since 2000
- With yields edging back and oil taking a stark tumble, is the Dollar playing a safe haven or sum other benefactor? Will PMIs Wednesday change the equation?

A General Skirmish Against Risk Appetite Looking for a Leader
Heading into early Wednesday trade, it seems that a general risk aversion is making for an uneven ground for speculative appetite to find its bearing. The majority of ‘risk assets’ that I tend to follow as a broad representation of sentiment slipped this past session. That said, the fundamental motivation behind the swoon didn’t seem to be a singular guiding light. That can prove a problem for establishing a clear and persistent bearing. While it is possible for various tributaries to flow into a singular view for market confidence, it is a far more improbable scenario. More practical for either risk on or risk off is to have an overriding theme carrying the market or otherwise have an unanchored bias cast aside the means for the sake of the ends.
This past session the biggest movers were a hodgepodge of standouts. A steep New Zealand Dollar and crude oil drop follows risk lines but for very different courses. Meanwhile, the Nasdaq 100, S&P 500 and Dow all slipped through the past session (at fairly equivalent tempos) without threatening major technical milestones. The small cap Russell 2000 in the meantime took a heavy -3.6 percent hit. It seems there is some rotation underneath the surface.

Chart of Russell 2000 with 100-Day Moving Average and 1-Day Rate of Change (Daily)
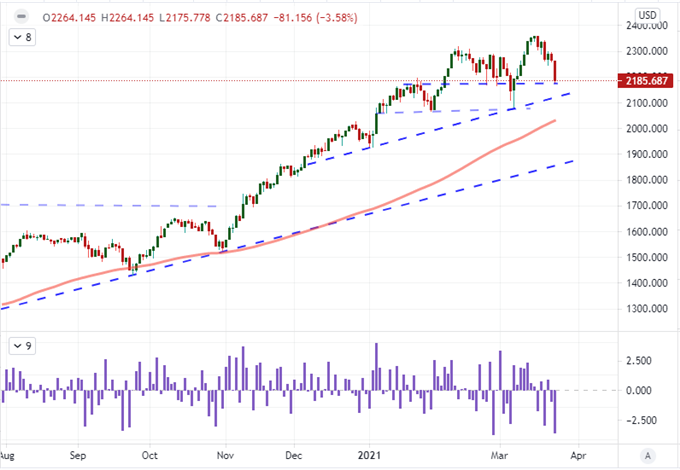
Chart Created on Tradingview Platform
A particular area of interest the relative tumble of the small cap index highlights is the possible reflection it casts on the post-pandemic retail interest we have seen build up over the past six months in particular. While disruptive tech stocks still appeal to the diehard bulls that are seeking some sort of justification for casting aside broader fundamentals, the smaller and less liquid headliners of 2021 are perhaps the more sensitive litmus test. GameStop initially bounced afterhours after reporting its disappointing earnings ($1.34 EPS versus $1.43 expected), but it ultimately dropped below 155. Other meme stocks suffered as well this past session, no doubt troubling those hanging hope on a diamond hand community. A Bank of America survey of social conversations led the research group to believe far less of the most recent round of stimulus would find its way into stock accounts. That may be true, but it is worth noting that Nasdaq 100 ETF (QQQ) registered its single largest daily inflow of capital, at $4.9 billion, Monday since 2000. Keep an eye on this intent.
Chart of QQQ Nasdaq 100 ETF with 200-Day Moving Average and Volume 20 SMA (Daily)
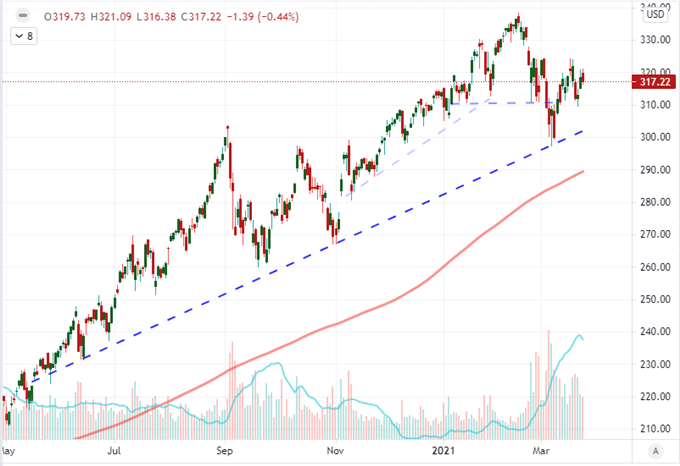
Chart Created on Tradingview Platform
Stimulus and Yields Generate Concern and Volatility
For more tangible fundamental motivations, the exceptional concern around rising yields seems to have drawn at least a modest amount of relief the past two sessions. The US 10-year Treasury yield has dropped for two consecutive sessions, but is hardly on course for a full relief of the 2021 swell if it remains above 1.50 percent. It is interesting though that the relationship between the US and global government bond market remains tight as it suggests the theme is still a global affair. Inflation fears are still a frequent topic of conversation and worry of lost control trails close behind.
Chart of US 10-Year Government Bond Yield with 100 SMA and Agg 10-Year Yield (Daily)
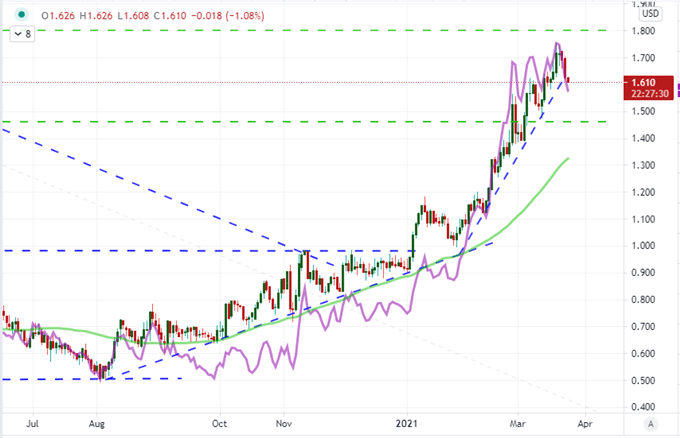
Chart Created on Tradingview Platform
Treasury yields are an interesting asset as its ubiquity can connect it to multiple fundamental themes. Was the retreat from the 14 month high in the 10-year a response to tempered inflation forecasts, concerns over growth or perhaps a traditional move towards risk aversion (it is a preferred haven in global crises). Some of the same considerations apply to the US Dollar. The DXY index managed to clear 92 this past session and is now eyeing the 200-day moving average at 92.50. Is this a relative growth advantage to US assets with the stimulus infusion or perhaps a natural risk off bounce for a safety currency? I don’t think the market is clear on that as different participants believe in different themes. It is possible to see a patchwork of motivation carry a trend; but just like risk, I would be dubious of the productivity of such a move until a clear driver is chosen.
Chart of DXY Dollar Index with 200 SMA and Implied Fed Fund Futures Hikes to 2022 (Daily)
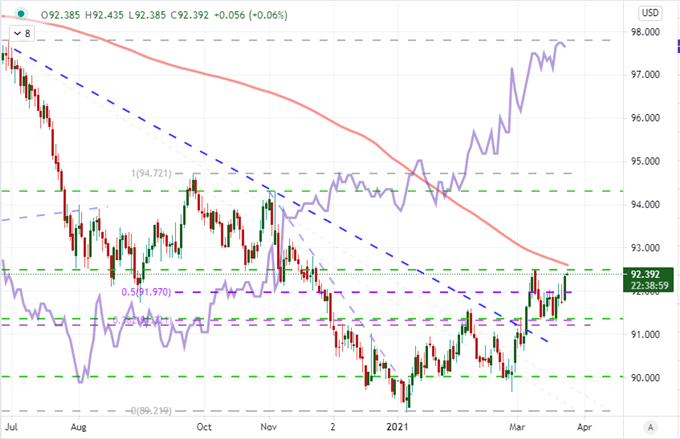
Chart Created on Tradingview Platform
Giving a little more weight to the monetary policy consideration carrying forward, we had Fed Chairman Jerome Powell testifying virtually in Congress Tuesday saying he is not concerned about inflation while Treasury Secretary Janet Yellen said she expects to return to full employment by next year. An idealized scenario that is impractical on the face of it. In reality, the slow moves to do stealth tapering/normalization continue following the Fed’s end of SVR and BOJ’s widened JGB band with a Bank of Canada official announcing an end to exceptional stimulus programs for the financial system amid worry of a FOMO pushing the housing market. The exception seems to have been the RBNZ which eschewed the option of a rate hike to seize fear of a housing bubble for a strategy of tax incentives. The Kiwi Dollar took a dive on the falter for the carry currency as NZDUSD clear 0.7100 and NZDJPY dove over -1.9 percent.
| Change in | Longs | Shorts | OI |
| Daily | 6% | -13% | 2% |
| Weekly | 40% | -35% | 15% |
Chart of NZDUSD with 100-Day Moving Average (Daily)
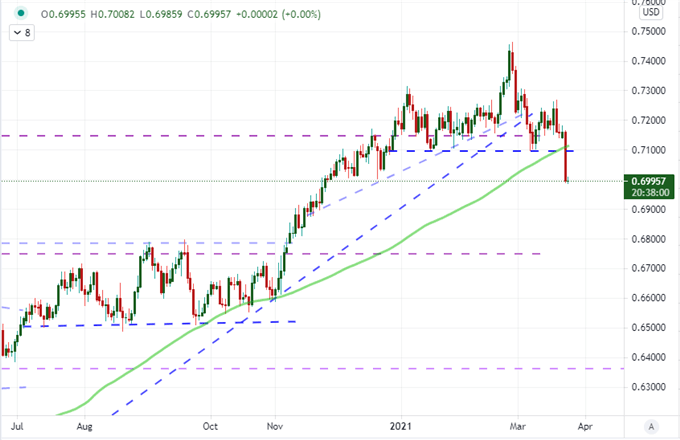
Chart Created on Tradingview Platform
A Shift in to the Classics: Economic Growth Forecasts
While sentiment with its prompts in retail tides, stimulus intent and yields is still a must watch for the fundamentally-inclined trader; we may find general growth add to the mix or possibly take over the steering with the correct prompts ahead. In addition to the drop in Treasury yields which have a growth sensitivity, crude oil took a heavy hit this past session. The commodity drop -5.8 percent this past session to clear further technical restraint on heavy volume. There are supply considerations and a general risk sensitive to consider here, but the connection to growth forecast cannot be overlooked.

Chart WTI Crude Oil with 20 and 50-Day Moving Averages and Volume
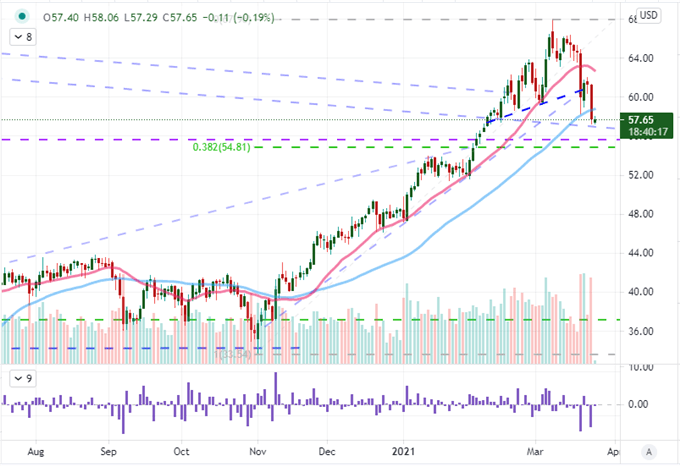
Chart Created on Tradingview Platform
For a comprehensive update on economic activity, the economic docket offers perhaps the best timely measure of activity we can find for a global view. The advanced readings of the March PMIs from some of the major developed world economies will be crossing the wires as the sessions progress through Wednesday. Already, the Australian composite accelerated for the month will the Japanese comprehensive reading barely nudged up and still remains in contractionary territory. I will be watching the Eurozone and US particularly for nudging the global view.
Chart of Major Economies Composite PMIs (Daily)
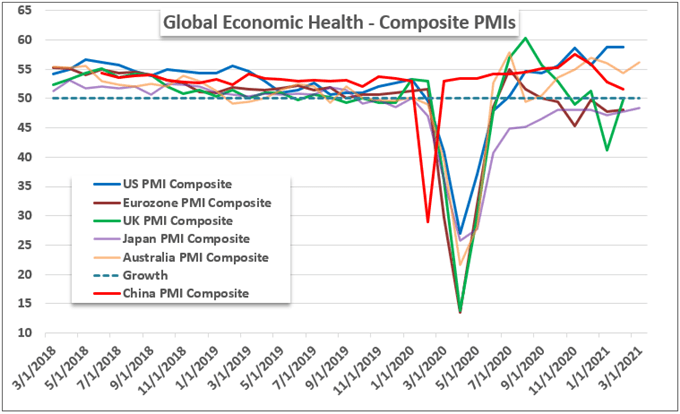
Chart Created by John Kicklighter with Data from Markit

.


