S&P 500, Dollar, EURUSD, USDCNH Talking Points:
- On paper, the S&P 500 earned a record high on an intraday and close basis, but a glance at the chart makes clear commitment is still unclear
- Risk trends are showing a very lackluster picture in global markets with US stimulus one of the few positive-leaning outlets – and that was not bullish
- A Dollar breakdown is more technically-impressive but where the EURUSD’s 1.1900 clearance is impressive, the picture is far less impressive the further out you look
Finally, A Record High for the S&P 500 And Still A Lack of Conviction
Context is important. If you were to simply take the relative level of the benchmark S&P 500 – a ‘risk’ leader for the scale of US stimulus, the familiarity of derivative interest and the sheer speculative gravity of the benchmark – the headline would be the market’s record high. On both a close over close and intraday basis, the measure forged a new unprecedented peak having overtaken the February 19th high. But does that translate into a shift in bullish intentions among the speculative rank? A quick look at the SPX’s chart would quickly dampen enthusiasm. Further, reference to other sentient-laden measures would call into question the depth of conviction. And, of course, there is the unfriendly reminder that we are passing through the seasonal trough for momentum in these drawn days of ‘Summer trade’.
Learn more about the three types of general Forex market analysis in our education section.


Chart of S&P 500 Overlaid by VIX Volatility Index with 10-Day ATR (Daily)
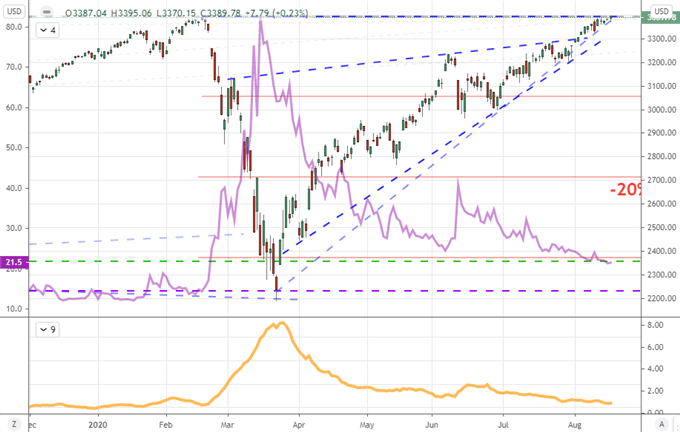
Chart Created on Tradingview Platform
Looking to the quality of risk trends underlying the market, there is certainly a concentration in speculative appetite that favors existing momentum. Equities outperforming other asset classes and US indices pacing their global counterparts remains a skew that seems to support the speculative appetites rather than traditional value. The most overt contrast of 2020 however remains the appeal of the tech-heavy Nasdaq Composite relative to even its most liquid peers (S&P 500 and Dow). The ratio of NDX to SPX below shows a remarkable degree of appetite that simply isn’t present in the baselines.
Chart of Nasdaq 100 to S&P 500 Ratio (Daily)
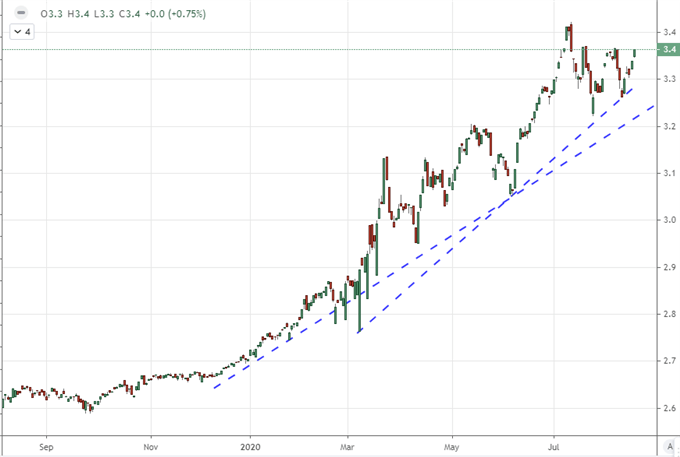
Chart Created on Tradingview Platform
Looking further out into other assets and regions, the breadth of genuine risk appetite falls apart quickly. Even the blue-chip Dow index was down this past session. Yet, the DAX, FTSE 100 and Nikkei 225 were also flagging from a global perspective. In fact, the VEU ‘rest of world’ equity ETF was treading water while the emerging market capital market measures the EEM was modestly lower. If these metrics continue to tread water, especially if the S&P 500 continues its climb, it will speak to a troubling imbalance that FX traders and other global macro observers should monitor closely.
Chart of VEU ‘Rest of World’ Equity ETF Overlaid with EEM Emerging Market ETF (Daily)
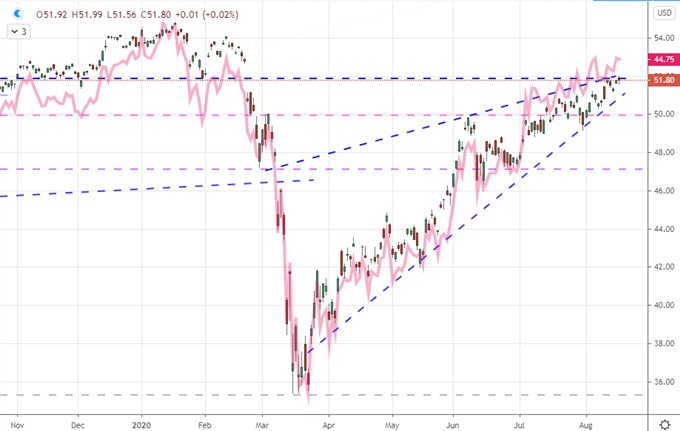
Chart Created on Tradingview Platform
The Dollar’s Bearish Break Is More Impressive but Just as Impractical
Where the S&P 500 was a break in the most nominal way possible, the Dollar managed clearance that a technician could truly appreciate. The DXY Index dropped below its month-long range – itself a remarkable milestone slipping an eight-year trendline support when it broke 94 – when it further dropped 92.50. While producing more follow through, this is hardly a sudden commitment to a new trend. What’s more, among the crosses, there progress is far from overwhelming.
Chart of DXY Dollar Index with 20-Day Moving Average (Weekly)
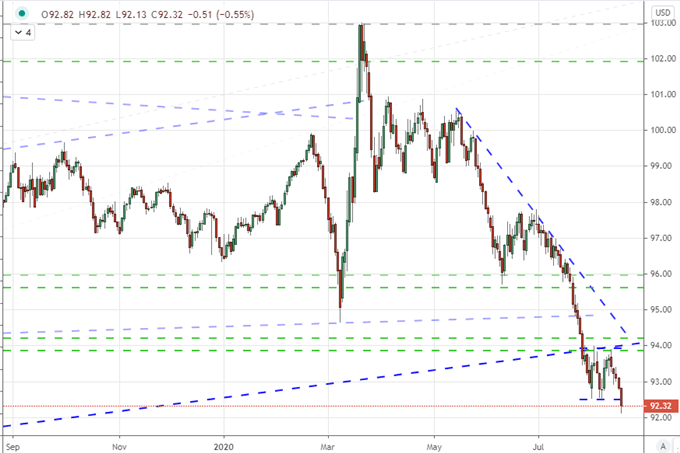
Chart Created on Tradingview Platform
First, from EURUSD, the technical progress was remarkable enough. Breaking 1.1900 resistance is an extension of a bullish progression over the past months which feeds into the 9th consecutive week of climb and backs a record net long interest in net speculative futures positions. With further news this past session that Congress and the White House remain at odds on their stimulus replacement program, there is a contrast to build on this pair. That said, if there is a breakthrough (a few headlines suggested compromise is in the wings), then perhaps there is also a sharper reversal from the Greenback. That said, EURUSD is the principal component of DXY; so it is no surprise that there is this level of technical scale.
| Change in | Longs | Shorts | OI |
| Daily | -1% | -4% | -3% |
| Weekly | 4% | -10% | -5% |
Chart of EURUSD with Net Spec Futures Positioning and Consecutive Candles (Weekly)
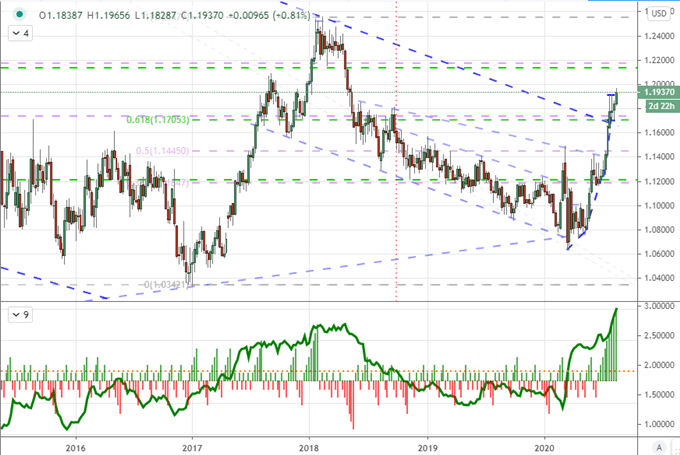
Chart Created on Tradingview Platform
Looking further out the liquidity scale for the Dollar majors, the impression of a solid bearish trend fades quickly. GBPUSD’s break above 1.3200 clears a trendline resistance dating back multiple years but a range resistance these past two years up to 1.3400 can readily rob momentum. Looking out to AUDUSD and USDCAD who are next in line with technical development, the intent is suddenly more tepid. Then in the emerging market crosses which theoretically better cater to risk trends, you don’t even have a break for the likes of the USDMXN, USDZAR or USDTRY.
Chart of USDMXN with 200-Day Moving Average (Daily)
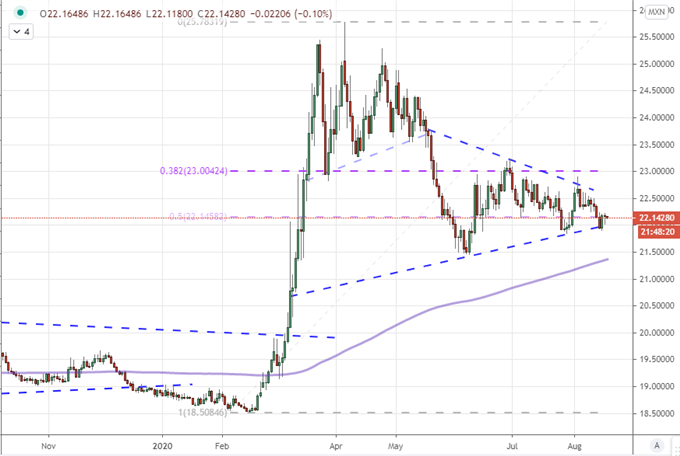
Chart Created on Tradingview Platform
A Surprising Fundamental Chart in Trade Wars
While I monitor the incredible uphill effort for an S&P 500 and Dollar break building traction over the coming days, I will keep close tabs on the systemic fundamental matters that can generate volatility should conviction still prove elusive. Stimulus, the pandemic and recession are drawn out matters which continue to anchor conviction and threaten outright concern. Then there is the revival in trade wars. Though the market has acclimatized itself to the United States weighing on global trade, there is still room for surprise. We received a rouse of concern this past session when the USDCNH further dropped below 6.9300 to extend the reversal from its record high near 7.20 and further break back below the vaunted 7.00 mark. With President Trump remarking the White House is no longer talking to China and that he can’t refute concerns that the trade deal will breakdown, it is worth watching whether this concern can spread to other areas of sentiment.
Chart of USDCNH (Daily)
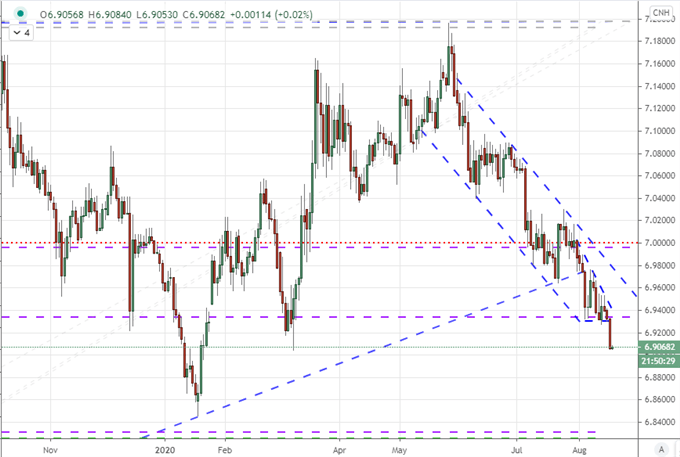
Chart Created on Tradingview Platform


If you want to download my Manic-Crisis calendar, you can find the updated file here.
.


