


Gold Technical Price Forecast:XAU/USD Weekly Trade Levels
- Gold price updated technical trade levels - Weekly Chart
- XAU/USD breaks weekly support- risk for further losses into May open
- New to Gold Trading? Get started with this Free How to Trade Gold -Beginners Guide s
Gold prices are down more than 2.3% this week with XAU/USD breaking key technical support before plunging to multi-week lows. The move threatens further losses in the weeks ahead and we’re on the lookout for a low heading into the May opening-range. These are the updated targets and invalidation levels that matter on the XAU/USD weekly price chart. Review my latest Weekly Strategy Webinar for an in-depth breakdown of thisgold technical setup and more.
Gold Price Chart - XAU/USD Weekly
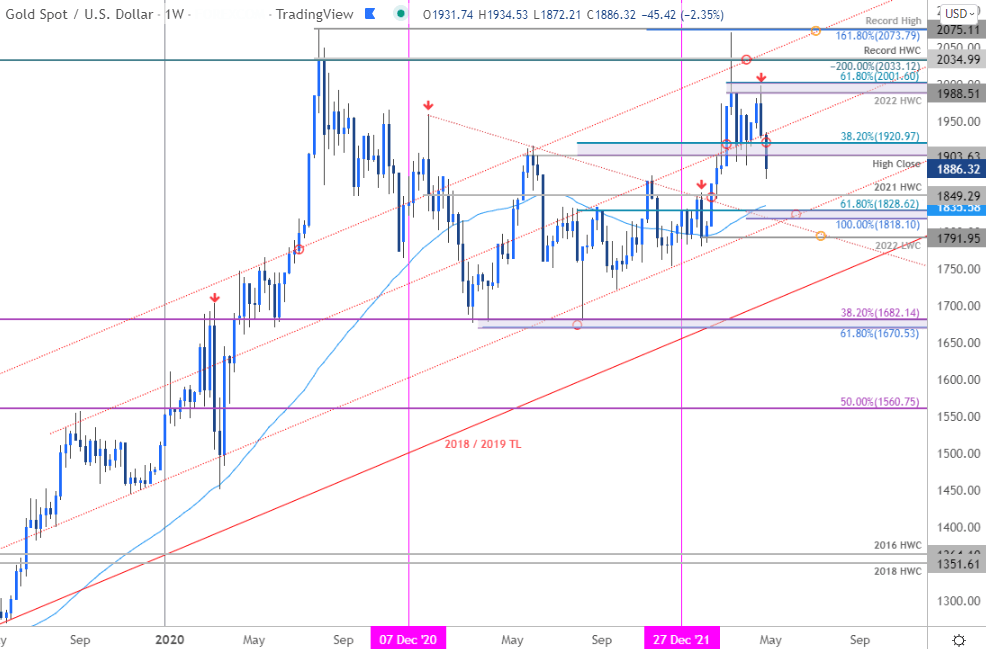
Chart Prepared by Michael Boutros, Technical Strategist; Gold on Tradingview
Notes: In my last Gold Weekly PriceOutlook we noted that a near-term breakout in XAU/USD had shifted, “the focus back towards key resistance around 2K – we need close above this threshold to mark resumption. From a trading standpoint, look to reduce portions of long-exposure / raise protective stops on a stretch towards 1988-2001- any pullbacks should be limited to the 1903 IF price is indeed heading higher.” Gold registered a high at 1998 in the following days before marking and outside-weekly reversal with the subsequent plunge taking price back through key support at 1903/20- a region defined by the May high-close and the 38.2% Fibonacci retracement of the August rally. The threat is lower while below this threshold.
Weekly support objectives from here eyed at the 2021 high-week close at 1849 backed by a critical confluence at the 100% extension of the yearly decline / 61.8% retracement of the 20221 rally at 1818/28- look for a larger reaction there IF reached. Initial resistance now back at 1920 with a breach / weekly close above the parallel (red near ~1934) needed to alleviate further downside pressure.

Bottom line: A technical breakdown of a multi-week range in gold keeps the risk tilted to the downside heading into the close of the month. From a trading standpoint, rallies should be capped by 1920 IF price is heading lower on this stretch with a close this week below 1903 needed to validate this breakdown. Review my latest Gold Price Outlook for a closer look at the near-term XAU/USD technical trade levels.
For a complete breakdown of Michael’s trading strategy, review his Foundations of Technical Analysis series on Building a Trading Strategy
Gold Trader Sentiment – XAU/USD Price Chart
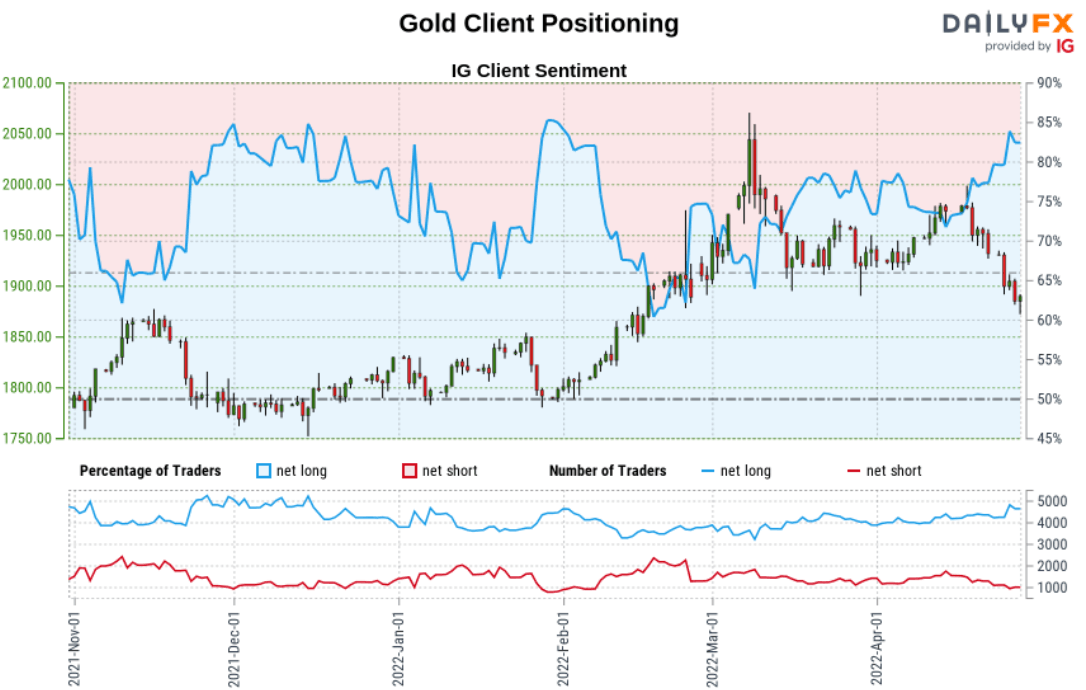
- A summary of IG Client Sentiment shows traders are net-long Gold- the ratio stands at +4.27 (81.02% of traders are long) – typically bearishreading
- Long positions are2.80% lower than yesterday and 1.99% higher from last week
- Short positions are 5.46% lower than yesterday and 24.23% lower from last week
- We typically take a contrarian view to crowd sentiment, and the fact traders are net-long suggests Gold prices may continue to fall. Traders are further net-long than yesterday and last week, and the combination of current positioning and recent changes gives us a stronger Gold-bearish contrarian trading bias from a sentiment standpoint.
| Change in | Longs | Shorts | OI |
| Daily | 1% | -3% | -1% |
| Weekly | 2% | -8% | -2% |
---
Previous Weekly Technical Charts
- British Pound (GBP/USD)
- Euro (EUR/USD)
- Canadian Dollar (USD/CAD)
- S&P 500, Nasdaq, Dow
- US Dollar Index (DXY)
- Crude Oil (WTI)
- Australian Dollar (AUD/USD)
- Written by Michael Boutros, Technical Strategist with DailyFX
Follow Michael on Twitter @MBForex


