


British Pound Technical Price Outlook: GBP/USD Weekly Trade Levels
- Sterling technical trade level update – Weekly Chart
- GBP/USD contracting into support at April opening-range lows- breakout pending
- Weekly resistance 1.3245/71, 1.3398, 1.3529 (key) – Support 1.3006(key),~1.2870s, 1.2754
The British Pound has collapsedagainst the US Dollar for a second consecutive week GBP/USD plunging more than 2.3%. The decline takes price into the a key technical pivot zone and while the broader threat remains lower, the focus is on a reaction here this week. These are the updated targets and invalidation levels that matter on the GBP/USD weekly chart. Review my latest Strategy Webinar for an in-depth breakdown of this Sterling technical setup and more.
British Pound Price Chart - GBP/USD Weekly
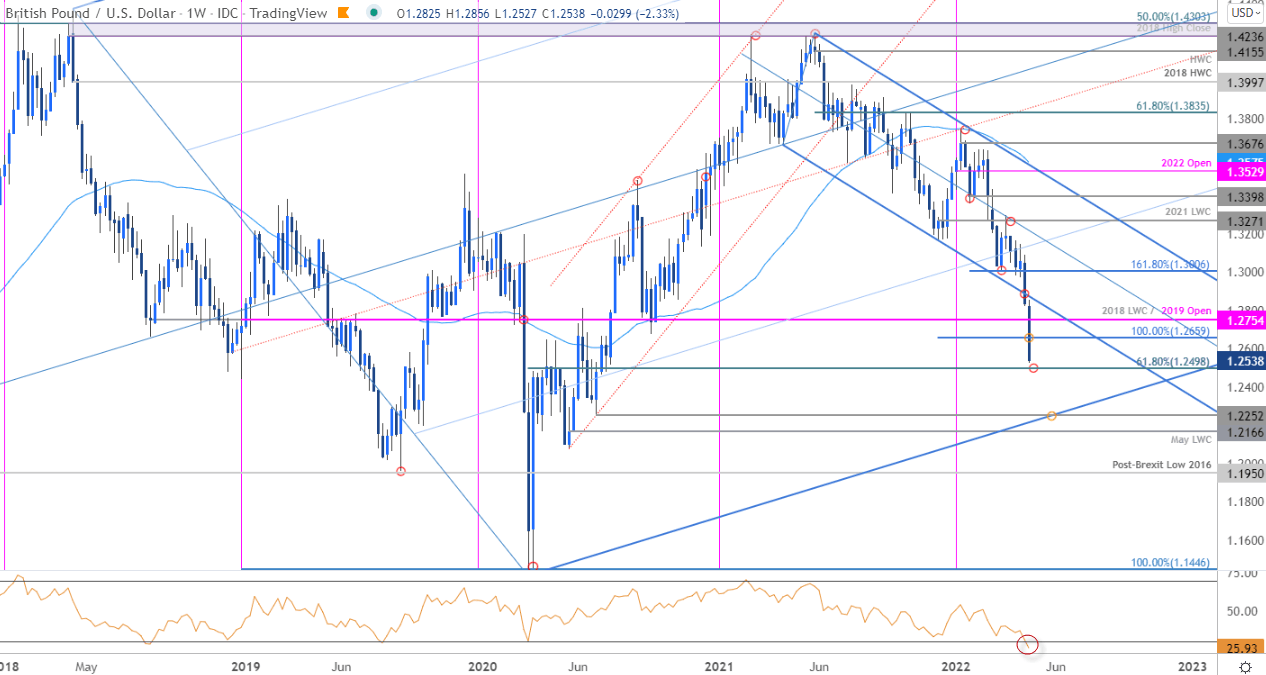
Chart Prepared by Michael Boutros, Technical Strategist; GBP/USD on Tradingview
Notes: In my last Sterling Technical Forecast we noted that, GBP/USD was, “contracting just above support within the monthly (April) opening-range- the battle lines are drawn heading into the April close. From a trading standpoint, the immediate focus is on a breakout with the broader risk still weighted to the downside while below downtrend resistance at the median-line.” A decisive break last week below downtrend support has fueled a massive sell-off with price now eyeing tertiary support objectives at the 61.8% Fibonacci retracement of the 2020 advance at 1.2498- looking for possible price inflection there IF reached.
Initial weekly resistance now at 1.2659 backed by the 2016 low-week close / 2019 yearly open at 1.2754. Broader bearish invalidation now lowered to this week’s high at 1.2856. It’s worth noting that IF price were to close the week at these levels, weekly momentum would be at its lowest point since the 2016 low. A break / weekly close below this technical pivot zone would likely fuel another accelerated decline towards subsequent support objectives at the June 2020 lows at 1.2252 and the May low-week close at 1.2166- both levels of interests for possible downside exhaustion IF reached.
For a complete breakdown of Michael’s trading strategy, review his Foundations of Technical Analysis series on Building a Trading Strategy
Bottom Line: The British Pound plunge is approaching an area of interest for medium-term price inflection and while the broader focus remains tilted to the downside, we’re looking for a reaction here this week. Ultimately, rallies should be capped by 1.2754 IF Cable is heading lower on this stretch with a close below 1.2498 needed to mark resumption of the broader downtrend. I’ll publish an updated Sterling Price Outlook once we get further clarity on the near-term GBP/USD technical trade levels. Stay tuned!

British Pound Trader Sentiment - GBP/USD Price Chart
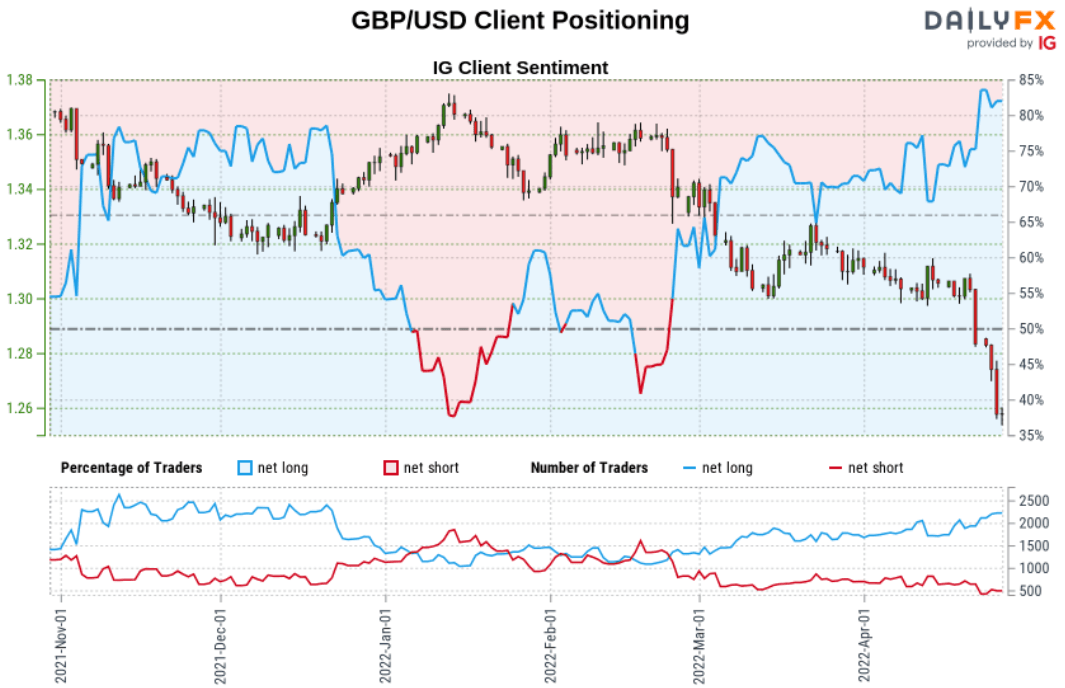
- A summary of IG Client Sentiment shows traders are net-long GBP/USD - the ratio stands at +4.10 (80.38% of traders are long) – typically bearish reading
- Long positions are 1.54% lower than yesterday and 13.50% higher from last week
- Short positions are 1.08% lower than yesterday and 19.77% lower from last week
- We typically take a contrarian view to crowd sentiment, and the fact traders are net-long suggests GBP/USD prices may continue to fall. Traders are less net-long than yesterday but more net-long from last week. The combination of current positioning and recent changes gives us a further mixed GBP/USD trading bias from a sentiment standpoint.
| Change in | Longs | Shorts | OI |
| Daily | 3% | -7% | -3% |
| Weekly | 4% | -10% | -5% |
---
UK / US Economic Calendar

Economic Calendar - latest economic developments and upcoming event risk.
Previous Weekly Technical Charts
- Euro (EUR/USD)
- Canadian Dollar (USD/CAD)
- S&P 500, Nasdaq, Dow
- US Dollar Index (DXY)
- Gold (XAU/USD)
- Crude Oil (WTI)
- Australian Dollar (AUD/USD)

--- Written by Michael Boutros, Technical Strategist with DailyFX
Follow Michael on Twitter @MBForex


