


Gold Technical Price Forecast: XAU/USD Weekly Trade Levels
- Gold price updated technical trade levels - Weekly Chart
- XAU/USD breakout extends into yearly trend resistance- Risk for exhaustion risk
- New to Gold Trading? Get started with this Free How to Trade Gold -Beginners Guide
Gold prices have surged nearly 12% off the August lows with the XAU/USD breakout now testing initial resistance objectives at five-week highs. While the broader focus remains constructive, the immediate advance may be vulnerable in the days ahead. These are the updated targets and invalidation levels that matter on the XAU/USD weekly technical chart. Review my latest Weekly Strategy Webinar for an in-depth breakdown of this gold technical setup and more.
Gold Price Chart - XAU/USD Weekly
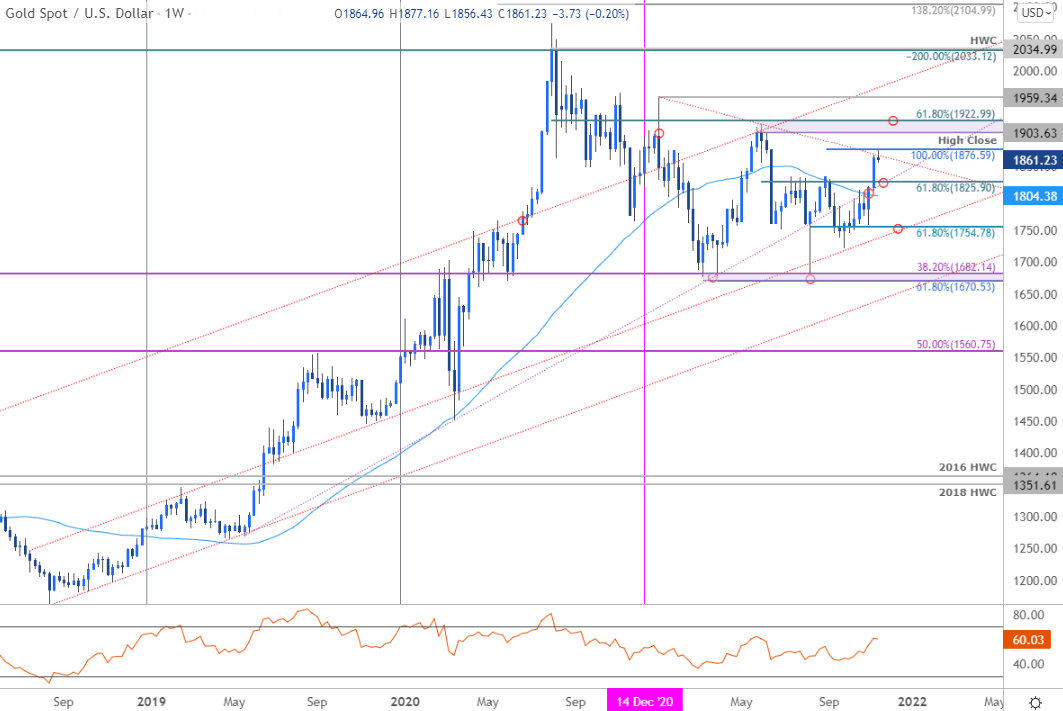
Chart Prepared by Michael Boutros, Technical Strategist; Gold on Tradingview
Notes: In my last Gold Weekly PriceOutlook we noted that, “A multi-month consolidation in Gold is taking shape just above broader uptrend support. From a trading standpoint, be on the lookout for downside exhaustion ahead of 1738 in the weeks ahead with a breach above 1849 ultimately needed to fuel the next leg higher towards 1900.” Price registered a low at 1758 in the following days before reversing sharply higher to close at 1864 last week.
The rally takes price into confluent resistance at the January trendline / 100% extension of the August advance at 1876- may see some kickback here. Initial support at 1825 backed by the 52-week moving average at 1804- both areas of interest for possible downside exhaustion IF reached. Broader bullish invalidation now raised to the 61.8% Fibonacci retracement of the August advance at 1754. A topside breach / close above this slope keeps the focus on critical resistance at the yearly high-close / June swing high / 61.8% retracement of the 2020 decline at 1903/23- look for a larger reaction / pivot there IF reached.

Bottom line: The Gold breakout takes price into confluent technical resistance at 1876 – the immediate long-bias may be vulnerable while below this threshold. From a trading standpoint, a good zone to reduce long-exposure / raise protective stops – ultimately a pullback here may offer more favorable opportunities closer to uptrend resistance. A topside breach from here keeps the focus on key resistance just above 1900. Review my latest Gold Price Outlook for a closer look at the near-term XAU/USD technical trade levels.
For a complete breakdown of Michael’s trading strategy, review his Foundations of Technical Analysis series on Building a Trading Strategy
Gold Trader Sentiment – XAU/USD Price Chart
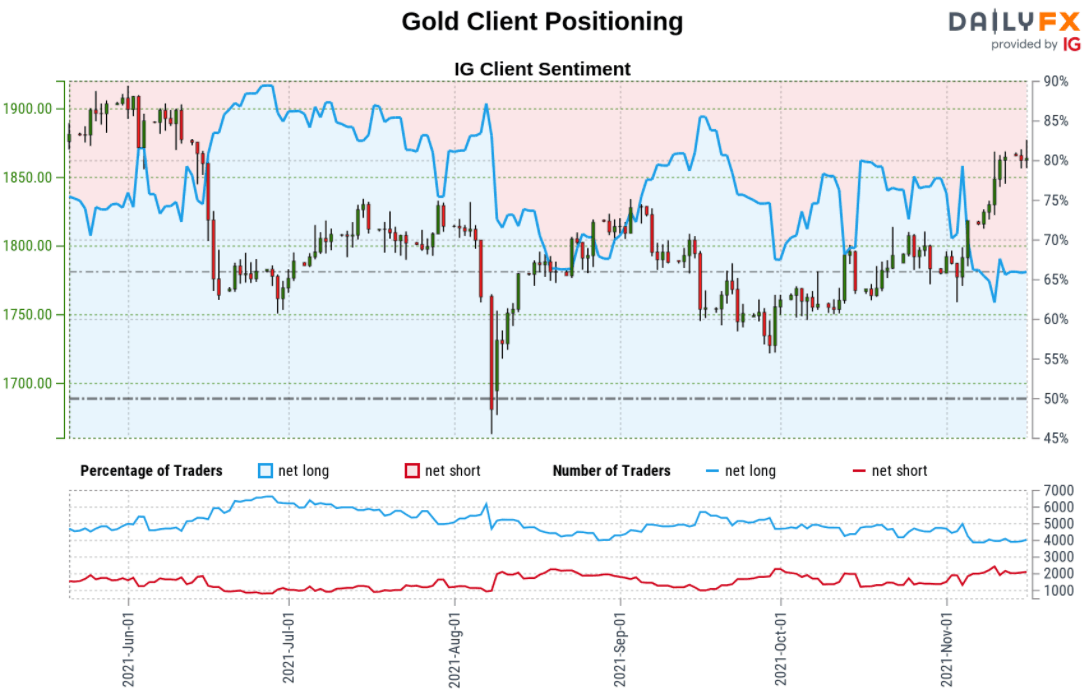
- A summary of IG Client Sentiment shows traders are net-long Gold- the ratio stands at +2.13 (68.08% of traders are long) – typically bearishreading
- Long positions are2.38% higher than yesterday and 3.87% higher from last week
- Short positions are 5.10% lower than yesterday and 16.74% lower from last week
- We typically take a contrarian view to crowd sentiment, and the fact traders are net-long suggests Gold prices may continue to fall. Traders are further net-long than yesterday and last week, and the combination of current positioning and recent changes gives us a stronger Gold-bearish contrarian trading bias from a sentiment standpoint.
| Change in | Longs | Shorts | OI |
| Daily | 1% | -3% | -1% |
| Weekly | 2% | -8% | -2% |
---
Economic Calendar

Previous Weekly Technical Charts
- US Dollar Index (DXY)
- Australian Dollar (AUD/USD)
- Canadian Dollar (USD/CAD)
- Sterling (GBP/USD)
- Euro (EUR/USD)
- Japanese Yen (USD/JPY)
- Crude Oil (WTI)
- Written by Michael Boutros, Currency Strategist with DailyFX
Follow Michael on Twitter @MBForex


