


Gold Technical Price Outlook: XAU/USD Weekly Trade Levels
- Gold price updated technical trade levels - Weekly Chart
- XAU/USD surges into first major resistance confluence at 1825/38- constructive above 1755
- New to Gold Trading? Get started with this Free How to Trade Gold -Beginners Guide
Gold prices have rallied towards a key resistance zone we’ve been tracking for weeks now and we’re looking for possible price inflection into the close of the month for guidance with US non-Farm Payrolls on tap this Friday. The battle-lines are drawn for the bulls heading into this threshold. These are the updated targets and invalidation levels that matter on the XAU/USD weekly technical chart. Review my latest Weekly Strategy Webinar for an in-depth breakdown of this gold technical setup and more.
Gold Price Chart - XAU/USD Weekly
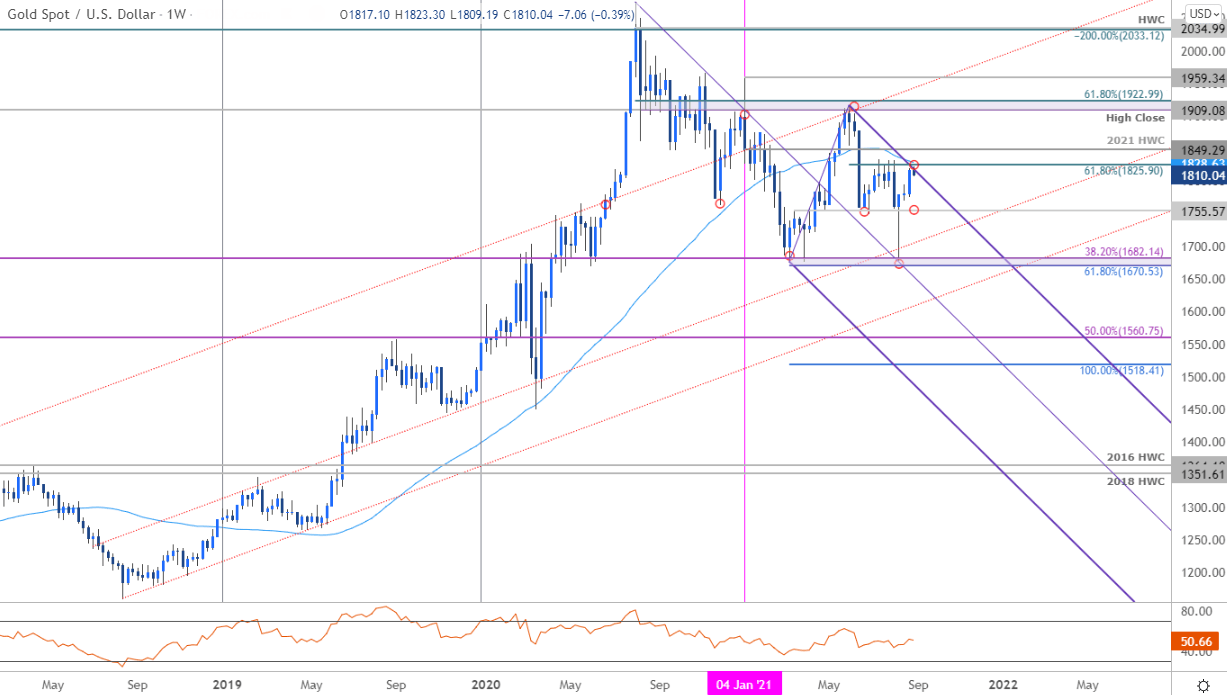
Chart Prepared by Michael Boutros, Technical Strategist; Gold on Tradingview
Notes: In last month’s Gold Weekly PriceOutlook we noted that the XAU/USD, “price collapse has responded to a critical technical support zone at the objective yearly lows- looking for the inflection off this zone to offer guidance.” The highlighted zone in focus was , “at the 1670/82 support confluence- a region defined by the 61.8% extension of the 2020 decline, the objective yearly opening-range low and the 38.2% retracement of the 2015 advance.” Bullion has rallied more than 8.5% off that low with price now approaching a key resistance confluence at 61.8% Fibonacci retracement of the June decline the 52-week moving average at 1825/28- note that the upper parallel also converges on this region this week and further highlights the technical significance of this resistance zone.
Weekly support rests at 1755- intra-week los ses should be limited to this threshold on pullbacks IF price is indeed heading higher. Critical support unchanged at 1670/82. Ultimately, a breach / close above the yearly high-week close at 1849 is needed to shift the broader focus higher again with such a scenario exposing topside objectives into the yearly highs at 1909/23.

Bottom line: The multi-week gold price rally is now testing the first major hurdle at downtrend resistance. From a trading standpoint, look to reduce long-exposure / raise protective stops on a stretch into 1825/28- be on the lookout for downside exhaustion ahead of 1755 with a close above 1849 needed to mark resumption of the broader uptrend. Review my latest Gold Price Outlook for a closer look at the near-term XAU/USD technical trade levels.
For a complete breakdown of Michael’s trading strategy, review his Foundations of Technical Analysis series on Building a Trading Strategy
Gold Trader Sentiment – XAU/USD Price Chart
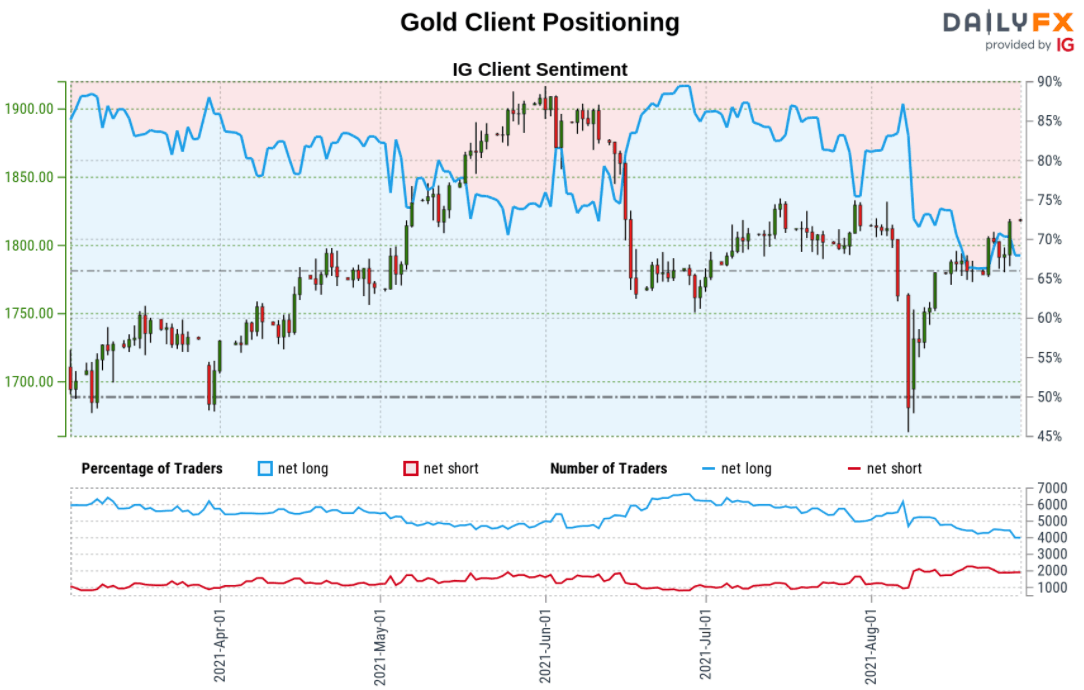
- A summary of IG Client Sentiment shows traders are net-long Gold- the ratio stands at +2.11 (67.90% of traders are long) – typically bearishreading
- Long positions areunchanged from yesterday and 9.14% lower from last week
- Short positions areunchanged from yesterday and 10.91% lower from last week
- We typically take a contrarian view to crowd sentiment, and the fact traders are net-long suggests Gold prices may continue to fall. Traders are less net-long than yesterday but more net-long from last week. The combination of current positioning and recent changes gives us a further mixed Gold trading bias from a sentiment standpoint.
| Change in | Longs | Shorts | OI |
| Daily | 1% | -3% | -1% |
| Weekly | 2% | -8% | -2% |
---
Previous Weekly Technical Charts
- US Dollar Index (DXY)
- New Zealand Dollar (NZD/USD)
- Australian Dollar (AUD/USD)
- Sterling (GBP/USD)
- Crude Oil (WTI)
- Canadian Dollar (USD/CAD)
- Euro (EUR/USD)
- Written by Michael Boutros, Currency Strategist with DailyFX
Follow Michael on Twitter @MBForex


