


S&P 500 PRICE OUTLOOK: VIX INDEX, CROSS-ASSET VOLATILITY PLUNGES AFTER JOBS DATA
- S&P 500, Dow Jones, Nasdaq explode higher with stocks surging in response to shockingly better-than-expected monthly jobs data
- VIX Index ‘fear-gauge’ collapses below its 200-day moving average as investor sentiment improves and cross-asset volatility normalizes
- The headline NFP figure provided a reason for optimism, but looking ‘under the hood’ paints a much bleaker picture and leaves the risk rally in jeopardy
The stock market is making another explosive move higher to close out the first week of June. Equities have advanced sharply on the back of jobs data just released, which smashed expectations, and primarily fueled the near 3% jump notched by the S&P 500 Index to trade back above the 3,200-price level.
| Change in | Longs | Shorts | OI |
| Daily | 1% | -1% | 0% |
| Weekly | 15% | -13% | -1% |
S&P 500 WITH VIX INDEX PRICE CHART: DAILY TIME FRAME (DEC 2019 – JUN 2020)
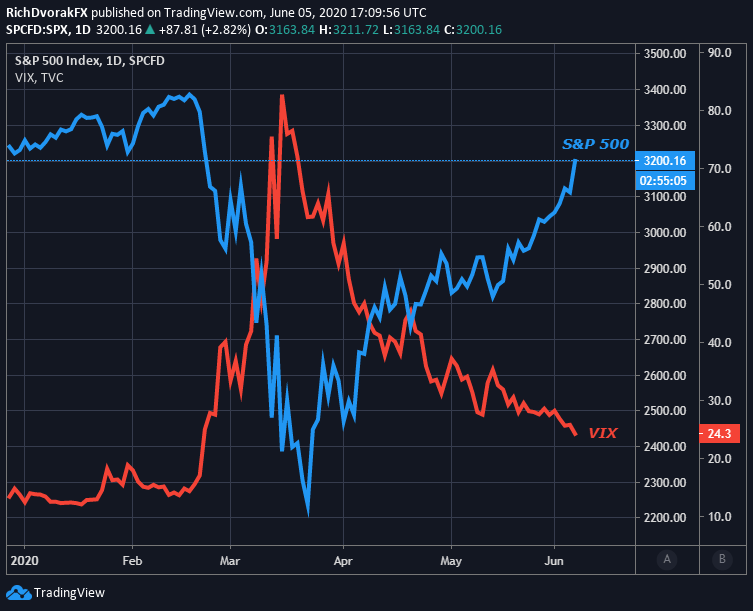
Chart created by @RichDvorakFX with TradingView
Meanwhile, as risk appetite crushes volatility and pushes stocks higher, the VIX Index has plunged back below its 200-day moving average to fluctuate near the 24.0-mark and its weakest reading since February. Though the VIX Index might keep bleeding lower to fill the gap-up above the 20-handle printed earlier this year, market sentiment could struggle to overlook this bad omen and several outstanding threats still faced by stocks.

US EMPLOYMENT SITUATION IMPROVED BUT LOST JOBS STILL STAGGERING

As one would expect, investors cheered better-than-expected readings for the unemployment rate and net change in nonfarm payrolls just detailed in May 2020 jobs report. According to the DailyFX Economic Calendar, actual figures for the unemployment rate and net change in NFP crossed the wires at 13.3% and 2.5 million, respectfully. This compares to median estimates looking for 19.8% and -7.5 million.
That said, the US employment situation still seems fundamentally damaged. The latest jobs report, while impressive on the surface, looks far worse when taken into perspective. Largely due to the coronavirus lockdown and likely unavoidable recession, nearly 20-million jobs have been obliterated over the last three months on balance. Total nonfarm payrolls currently stands at 132.9-million employed Americans, which puts the US labor market on par with December 2011 levels.

Questionable calculation methodologies, like showing an increase in employment even with no new hiring, appear to have artificially inflated the headline nonfarm payrolls number as well. Further, a rebound in consumption to pre-COVID levels seems like a fantasy with 21.5-million Americans still filing for unemployment insurance amid widespread social unrest underpinned by rioting and looting alongside George Floyd protests.
VIX INDEX FUTURES TERM STRUCTURE

This is also increasing the odds for a second wave of coronavirus cases. Not to mention, Sino-American trade uncertainty still lurks on the horizon as China tension flares, which presents another headwind to recovering consumer confidence. Since 29 May, the shift lower across monthly VIX Index futures settlements appears more pronounced on the short end of the curve.

This might indicate that investors, though increasingly optimistic, remain cautious with regards to market outlook further down the horizon. Also judging by VIX Index futures, expected S&P 500 volatility is particularly elevated around October and November 2020, which happens to align with the upcoming US presidential election and presents a source of uncertainty.
-- Written by Rich Dvorak, Analyst for DailyFX.com
Connect with @RichDvorakFX on Twitter for real-time market insight


