


Sterling Technical Price Outlook: GBP/USD Weekly Trade Levels
- Sterling technical trade level update – Weekly Chart
- GBP/USD rips towards 2021 downtrend resistance- threat for topside exhaustion
- Resistance 1.3658, 1.3746 (key) – support 1.3494
The British Pound is attempting to mark a fourth consecutive weekly advance against the US Dollar with GBP/USD now approaching technical resistance ahead of key US inflation data. We’re on the lookout for possible inflection up here as Cable approaches multi-month resistance at multi-month highs. These are the updated targets and invalidation levels that matter on the GBP/USD weekly chart. Review my latest Strategy Webinar for an in-depth breakdown of this Sterling technical setup and more.
Sterling Price Chart - GBP/USD Weekly

Chart Prepared by Michael Boutros, Technical Strategist; GBP/USD on Tradingview
Notes: Sterling posted a range of more than 7.6% last year with a reversal from key technical resistance near the 1.43-handle plunging into the 1.32-handle late in the year. A rebound off downtrend support in December has carried into the new year with a rally of more than 3.5% off the 2021 lows now approaching resistance at the multi-month downtrend. So is it time to fade or is this setting up for a larger breakout for the British Pound?
Weekly resistance stands at the upper parallel of the descending pitchfork we’ve been tracking off the 2021 highs / 2017 swing high at 1.3658- a breach / weekly close above this threshold is needed to keep the immediate rally viable with such a scenario exposing confluent resistance around the 52-week moving average near ~1.3750s. Initial weekly support rests at the 2017 high-week close at 1.3494 with a break of the monthly opening-range lows at 1.3431 needed to shift the broader focus lower again in the Pound.
For a complete breakdown of Michael’s trading strategy, review his Foundations of Technical Analysis series on Building a Trading Strategy
Bottom Line: Sterling is attempting a fourth consecutive weekly advance and takes price towards downtrend resistance just higher- risk for exhaustion. From a trading standpoint, a good zone to reduce long-exposure / raise protective stops on a stretch towards 1.3658 IF reached- look for a reaction there. Stay nimble into key US inflation data tomorrow and watch the weekly close for guidance here. I’ll publish an updated Sterling Price Outlook once we get further clarity on the near-term GBP/USD technical trade levels.

Sterling Trader Sentiment - GBP/USD Price Chart
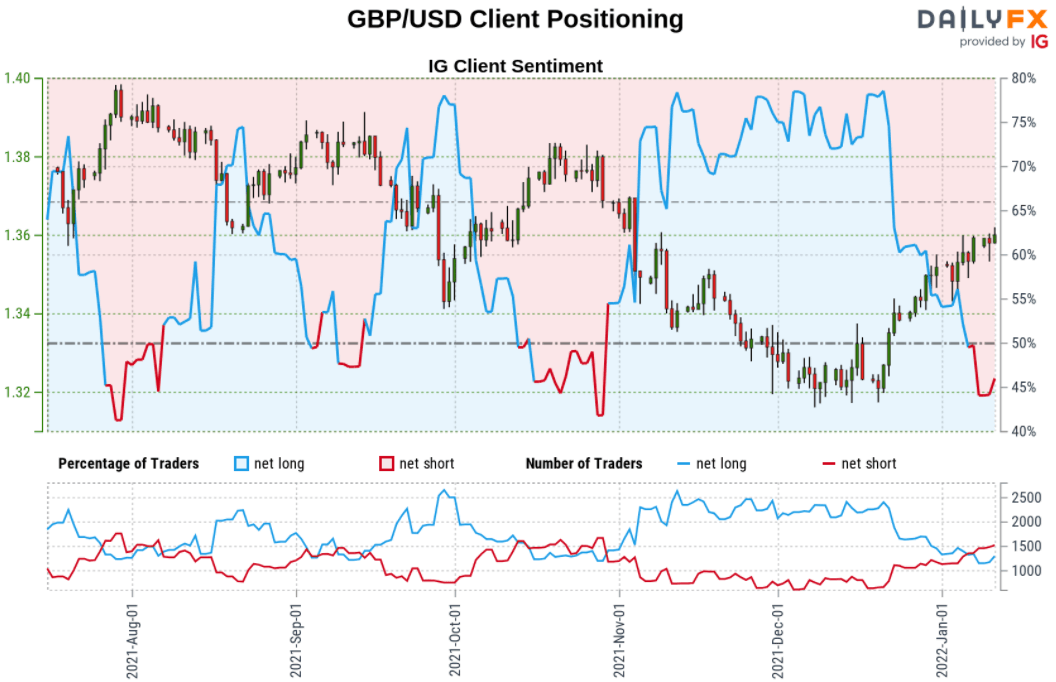
- A summary of IG Client Sentiment shows traders are net-short GBP/USD - the ratio stands at -1.20 (45.45% of traders are long) – typically weak bullish reading
- Long positions are 8.05% higher than yesterday and 11.73% lower from last week
- Short positions are0.49% higher than yesterday and 27.23% higher from last week
- We typically take a contrarian view to crowd sentiment, and the fact traders are net-short suggests GBP/USD prices may continue to rise. Traders are less net-short than yesterday but more net-short from last week. The combination of current positioning and recent changes gives us a further mixed GBP/USD trading bias from a sentiment standpoint.
| Change in | Longs | Shorts | OI |
| Daily | 3% | -7% | -3% |
| Weekly | 4% | -10% | -5% |
---
UK / US Economic Calendar
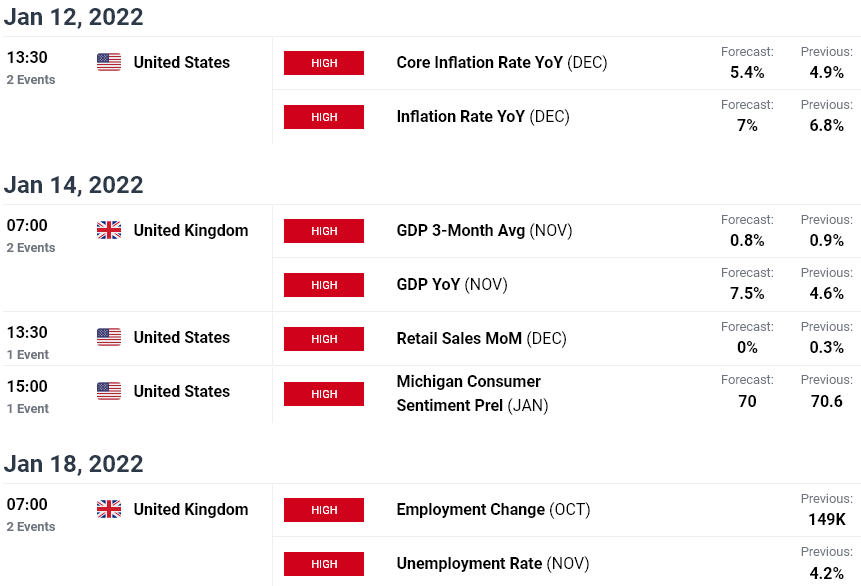
Economic Calendar - latest economic developments and upcoming event risk.
Previous Weekly Technical Charts

--- Written by Michael Boutros, Technical Currency Strategist with DailyFX
Follow Michael on Twitter @MBForex


