


US Dollar Technical Price Outlook: DXY Weekly Trade Levels
- US Dollar technical trade level update – Weekly Chart
- USD rally stalls into pivotal resistance zone- threat for correction
- DXYsupport 95.15, 94.47(bullish invalidation) – Key resistance 96.50/67, 97.70
The US Dollar Index opens the month / year just below a pivotal resistance barrier and the focus is on a possible inflection off this threshold in the weeks ahead. Although the broader outlook is still constructive, the threat for a near-term correction remains while below this key zone. These are the updated technical targets and invalidation levels that matter on the US Dollar Index weekly price chart. Join my Weekly Strategy Webinars for an in-depth breakdown of thisDXY technical setup and more.
US Dollar Index Price Chart – DXY Weekly
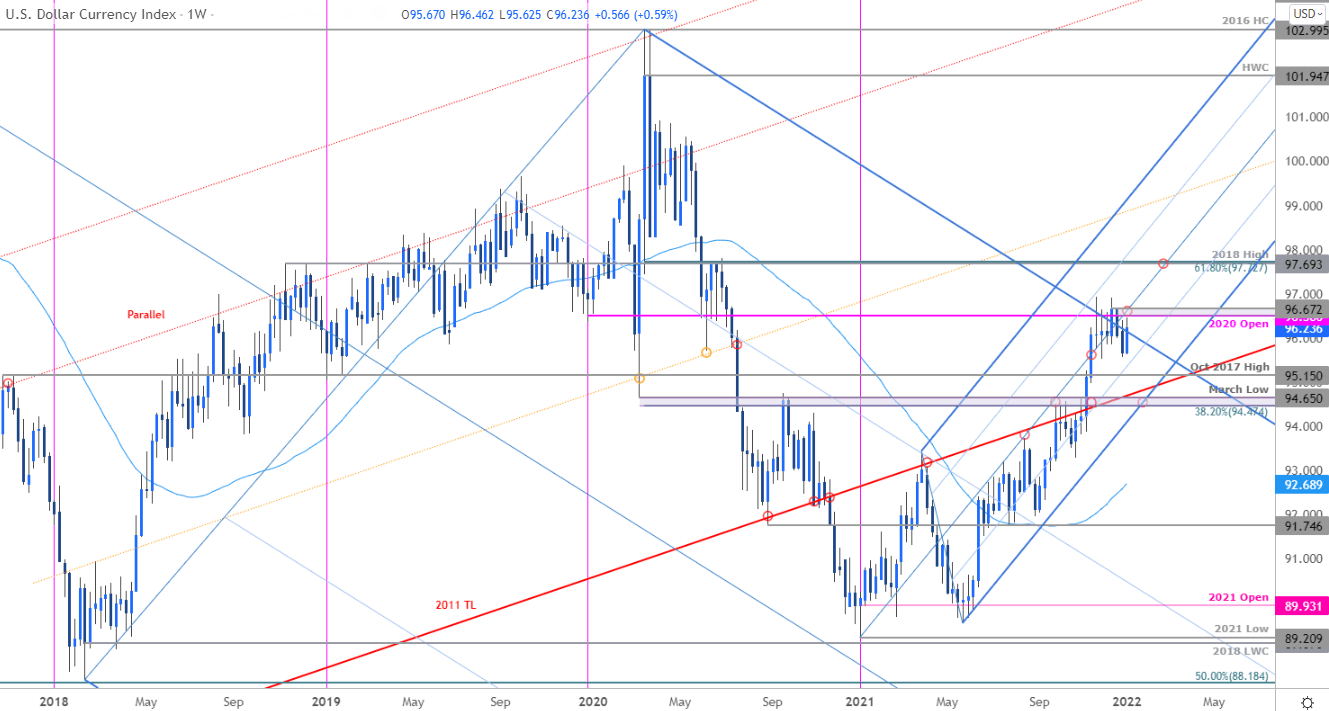
Chart Prepared by Michael Boutros, Technical Strategist; US Dollar Index on Tradingview
Notes: In my last US Dollar Weekly Price Outlook we noted that a breakout in DXY was underway with a, “weekly close above 95.15 needed to mark resumption towards the median-line (currently ~95.70s) and critical resistance at 96.10/50- area of interest for possible topside exhaustion IF reached.” The index ripped the following weeks with DXY registering a high-close at 96.67 in December before pulling back. Is the Dollar poised for a pullback?
The index has rallied more than 8.2% off the May lows with the largest correction measuring just 1.9% and while this is not a reason to be bearish, it does highlight the seasonal threat for USD weakness. With that in mind, the broader outlook still remains constructive while above 94.47/65 with initial support now back at 95.15. Critical resistance is now adjusted to the 2020 yearly open / 2021 high close at 96.50/67 – a topside breach / weekly close above this threshold is needed to mark resumption with such a scenario exposing the median-line (currently ~97) and the 2018 high / 61.8% Fibonacci retracement of the 2020 decline at 97.69/72.
For a complete breakdown of Michael’s trading strategy, review his Foundations of Technical Analysis series on Building a Trading Strategy
Bottom line: The US Dollar rally has stalled into a major resistance zone at 96.50/67. From a trading standpoint, a good region to reduce long-exposure / raise protective stops. Losses should be limited to 94.47 IF price is indeed heading higher with a topside breach from here likely to fuel another accelerated run towards 97 and beyond. Keep in mind we still have US Non-Farm Payrolls (NFP) on tap this Friday – look to the weekly close for guidance. I’ll publish and updated US Dollar Price Outlook once we get further clarity on the near-term technical trade levels.

Key US Data Releases
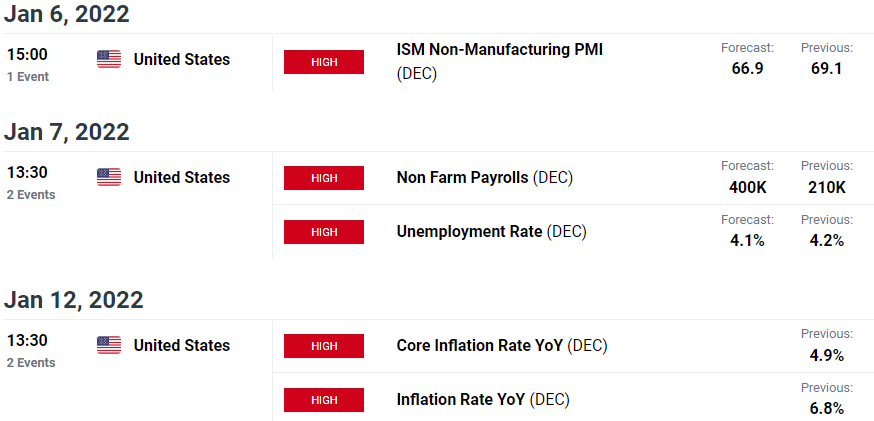
Economic Calendar - latest economic developments and upcoming event risk.
Previous Weekly Technical Charts
--- Written by Michael Boutros, Technical Strategist with DailyFX
Follow Michael on Twitter @MBForex


