


Gold Technical Price Forecast: XAU/USD Weekly Trade Levels
- Gold price updated technical trade levels - Weekly Chart
- XAU/USD snaps three-week rally- constructive while above 1754
- New to Gold Trading? Get started with this Free How to Trade Gold -Beginners Guide s
Gold prices are attempting to snap a three-week winning streak with XAU/USD down 0.97% into the yearly open. A key resistance hurdle may interrupt the advance here and we’re on the lookout for a near-term price breakout to offer guidance early in the month. These are the updated targets and invalidation levels that matter on the XAU/USD weekly technical chart. Join my Weekly Strategy Webinars for an in-depth breakdown of this gold technical setup and more.
Gold Price Chart - XAU/USD Weekly
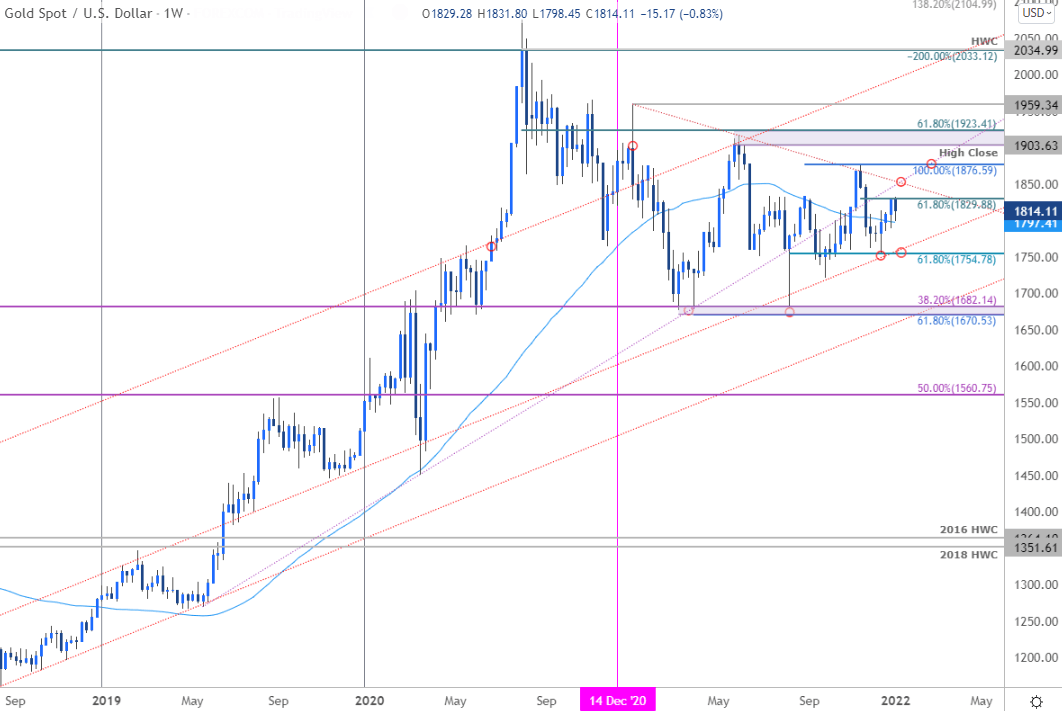
Chart Prepared by Michael Boutros, Technical Strategist; Gold on Tradingview
Notes: In my last Gold Weekly PriceOutlook we noted that the XAU/USD, “breakout takes price into confluent technical resistance at 1876 – the immediate long-bias may be vulnerable while below this threshold.. ” Gold registered a high at 1877 that week before reversing sharply lower with the decline rebounding off key Fibonacci support into the close of the December. Is this resumption of the broader uptrend?
The stage is set heading into the yearly / monthly open with gold trading within a key range above the 52-week moving average (~1797) and below the 61.8% retracement of the November sell-off at 1829- look for a breakout of this range for guidance. Key support / bullish invalidation remains unchanged at 1754. A topside breach from here keeps the focus on subsequent resistance objectives at the highlighted trendline confluence near ~1855 and the 100% extension of the August rally at 1876. Ultimately a breach / close above the 2021 high-close / 61.8% retracement of the 2020 decline at 1903/23 is needed to mark resumption of the multi-year uptrend in gold.

Bottom line: The recent gold recovery is trading just below near-term resistance into the yearly open. From a trading standpoint, the focus remains on a breakout of the 1797-1829 range for guidance with the broader outlook constructive while above 1754- Look for an exhaustion low ahead of this zone IF price is heading higher with a breach above the 2021 trendline needed to fuel the next leg higher in price. I’ll publish an updated Gold Price Outlook once we get further clarity on the near-term XAU/USD technical trade levels.
For a complete breakdown of Michael’s trading strategy, review his Foundations of Technical Analysis series on Building a Trading Strategy
Gold Trader Sentiment – XAU/USD Price Chart
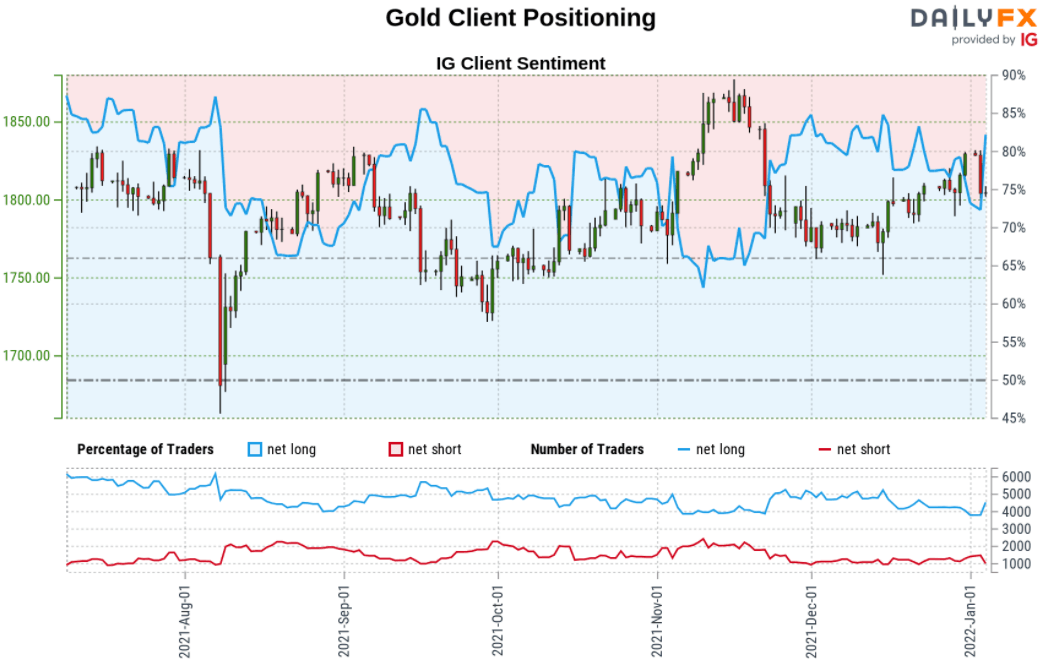
- A summary of IG Client Sentiment shows traders are net-long Gold- the ratio stands at +4.28 (81.05% of traders are long) – typically bearishreading
- Long positions are17.24% higher than yesterday and 6.10% higher from last week
- Short positions are 29.84% lower than yesterday and 14.53% lower from last week
- We typically take a contrarian view to crowd sentiment, and the fact traders are net-long suggests Gold prices may continue to fall. Traders are further net-long than yesterday and last week, and the combination of current positioning and recent changes gives us a stronger Gold-bearish contrarian trading bias from a sentiment standpoint.
| Change in | Longs | Shorts | OI |
| Daily | 1% | -3% | -1% |
| Weekly | 2% | -8% | -2% |
---
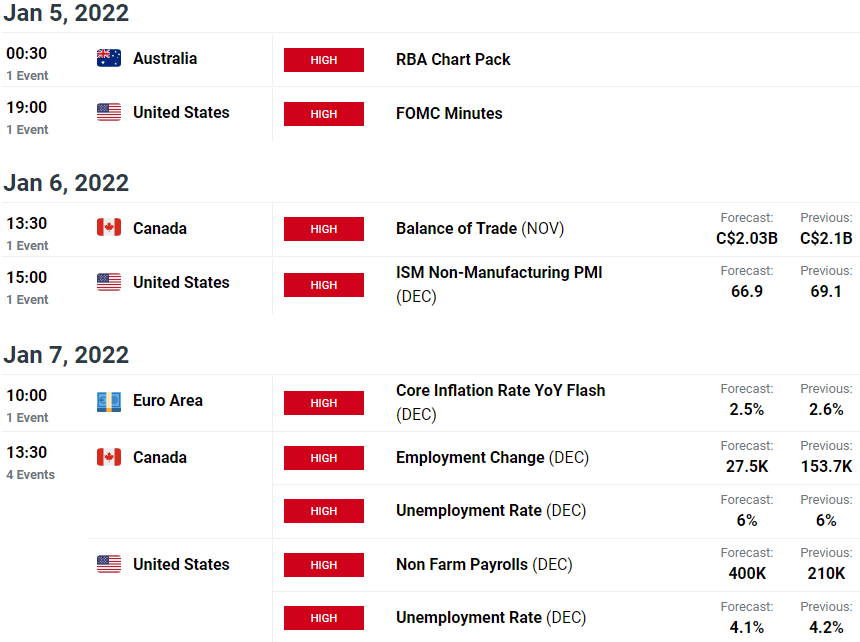
Key Data Releases This Week – Economic Calendar
Previous Weekly Technical Charts
- Written by Michael Boutros, Technical Strategist with DailyFX
Follow Michael on Twitter @MBForex


