


Sterling Technical Price Outlook: GBP/USD Trade Levels
- Sterling technical trade level update – Daily & Intraday Charts
- GBP/USD carves April opening-range just above support– breakout to offer guidance
- Key support 1.346/75- near-term bearish invalidation 1.3824.
The British Pound is poised to snap a four-day losing streak against the US Dollar with GBP/USD rebounding off key technical support into the weekly open. The recovery may be short lived however as Sterling continues to trade within the confines of a multi-month downtrend. These are the updated targets and invalidation levels that matter on the GBP/USD price charts. Review my latest Weekly Strategy Webinar for an in-depth breakdown of this Sterling technical setup and more.
Sterling Price Chart – GBP/USD Daily
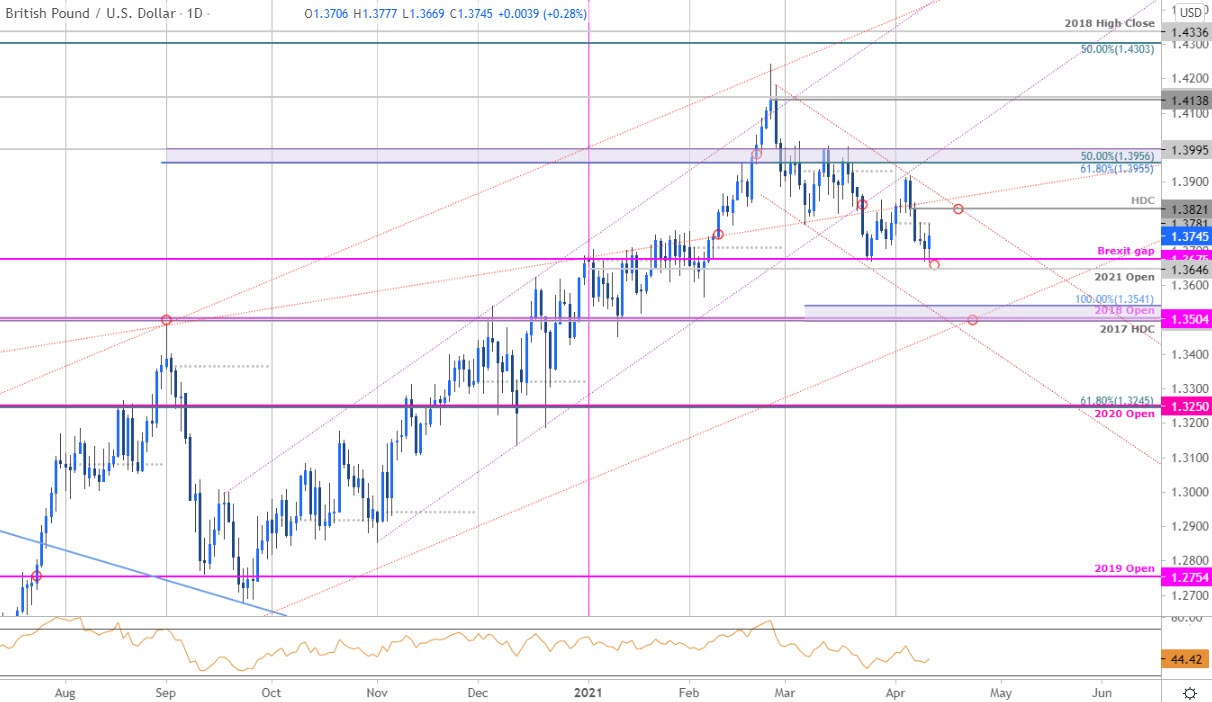
Chart Prepared by Michael Boutros, Technical Strategist; GBP/USD on Tradingview
Technical Outlook: In last month’s Sterling Price Outlook we noted that the GBP/USD was, “in consolidation just below resistance at the March range highs- respect a breakout of the monthly opening-range.” A break lower on March 23rd gave way to a 1.3% decline with Cable dropping into a more significant lateral support zone at the objective yearly open / Brexit gap at 1.3646/75. The April opening-range has now been carved out above this threshold and we’re looking for the breakout for guidance here.
Daily resistance stands with the objective monthly open at 1.3781 backed by the April high-day reversal close (outside day) at 1.3821- look for topside exhaustion ahead of the February trendline IF price is heading lower with a break / close below the yearly open exposing subsequent support objectives at 1.3495-1.3541- a region defined by the 2017 high-day close, the 2018 yearly open and the 100% extension of the February decline.
Sterling Price Chart – GBP/USD 240min
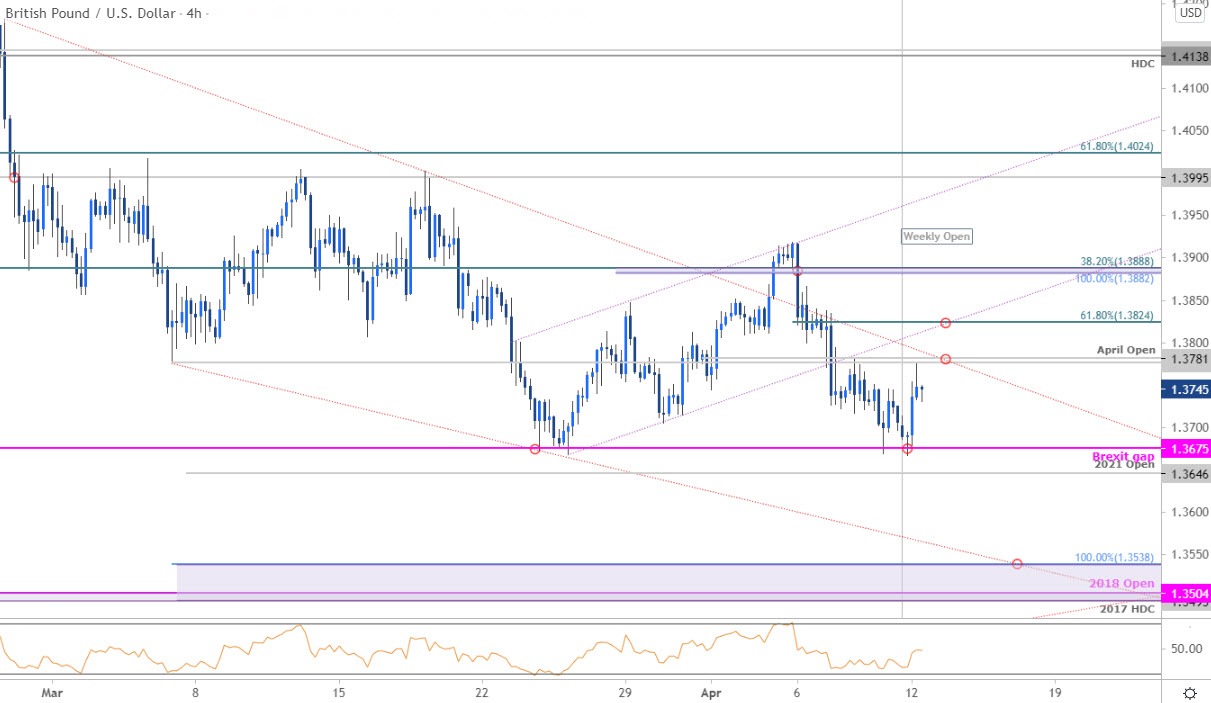
Notes: A closer look at Sterling price action shows GBP/USD rebounding of key support at 1.3646/75 with price threatening an outside-day reversal off the lows into the weekly open. Initial resistance eyed at 1.3776/81 backed by near-term bearish invalidation at the 61.8% Fibonacci retracement at 1.3824 - both zones of interest for possible topside exhaustion IF reached. Ultimately, a breach above 1.3995-1.4024 would be needed to mark resumption of the broader uptrend towards the yearly high-day close at 1.4138.

Bottom line: Sterling has set the monthly opening-range just above the March lows / lateral support – the immediate focus is on a breakout for guidance. From a trading standpoint, look for possible topside exhaustion into the February trendline with a close below 1.3646 needed to validate a deeper correction. Keep in mind we have the February GDP figures from the UK on tap tomorrow. Review my latest British Pound Weekly Price Outlook for a closer look at the longer-term GBP/USD technical trade levels.
For a complete breakdown of Michael’s trading strategy, review his Foundations of Technical Analysis series on Building a Trading Strategy
Sterling Trader Sentiment – GBP/USD Price Chart
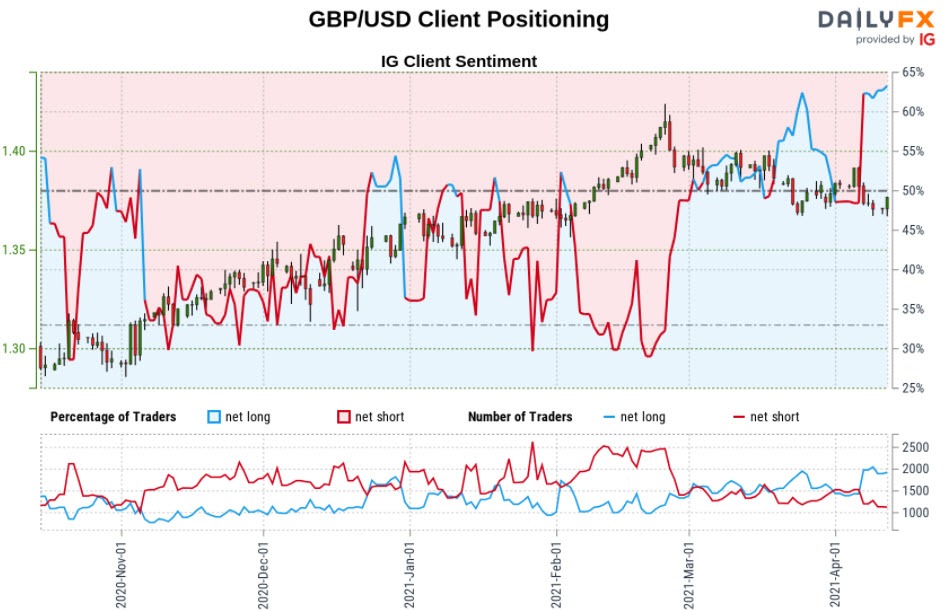
- A summary of IG Client Sentiment shows traders are net-long GBP/USD - the ratio stands at +1.62 (61.83% of traders are long) – typically bearish reading
- Long positions are5.64% higher than yesterday and 37.36% higher from last week
- Short positions are12.38% higher than yesterday and 14.98% lower from last week
- We typically take a contrarian view to crowd sentiment, and the fact traders are net-long suggests GBP/USD prices may continue to fall. Yet traders are less net-long than yesterday but more net-long from last week. The combination of current positioning and recent changes gives us a further mixed GBP/USD trading bias from a sentiment standpoint.
| Change in | Longs | Shorts | OI |
| Daily | 8% | -2% | 4% |
| Weekly | -13% | 4% | -6% |
---
UK / US Economic Calendar

Economic Calendar - latest economic developments and upcoming event risk.
Active Technical Setups
- Gold Price Outlook: Gold Surges into April- XAU/USD Risks Breakout
- Canadian Dollar Outlook: USD/CAD Plunges into April- Support Ahead
- Mexican Peso Outlook: USD/MXN Plummets into Support– Bears Face NFP
- US Dollar Outlook: DXY Breakout Vulnerable into April Open / NFP
- Euro Outlook: EUR/USD Plummets Towards 1.17- Bear March into April
- Written by Michael Boutros, Currency Strategist with DailyFX
Follow Michael on Twitter @MBForex


