


Gold Technical Price Outlook: XAU/USD Near-term Trade Levels
- Gold price updated technical trade levels – Daily & Intraday Charts
- XAU/USD threatens breakout into the April open- Bearish invalidation 1785, key support 1707
- New to Gold Trading? Get started with this Free How to Trade Gold -Beginners Guide
Gold prices have surged nearly 4% off the March lows with XAU/USD threatening a major breakout in early April trade. While the immediate focus is on this recovery, the advance may be vulnerable into uptrend resistance just higher and we’re on the lookout for possible exhaustion on this stretch. These are the updated targets and invalidation levels that matter on the XAU/USD technical charts heading into the April opening-range. Review my latest Strategy Webinar for an in-depth breakdown of this gold technical setup and more.
Gold Price Chart - XAU/USD Daily
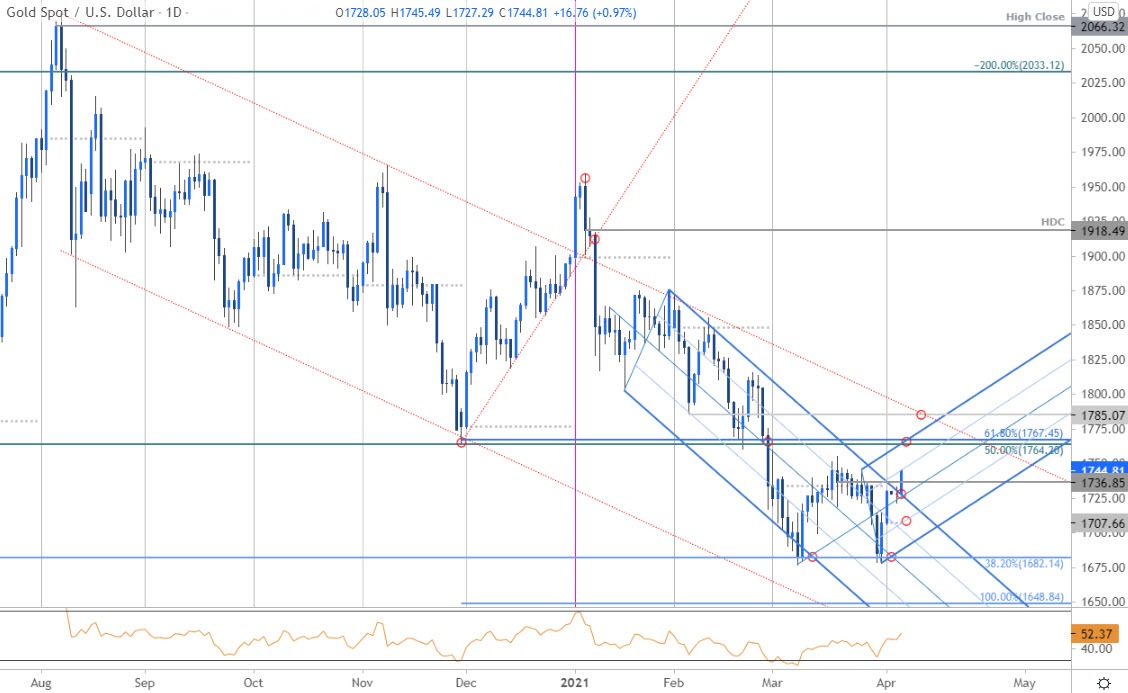
Chart Prepared by Michael Boutros, Technical Strategist; Gold on Tradingview
Technical Outlook: In my last Gold Price Outlook we noted support objectives into, “the yearly low-day reversal close at 1683. Basically, the downside is littered with levels here but IF price breaks lower, expect another accelerated drop towards more significant support at 1649.” Price registered a low at 1678 before reversing sharply higher with the subsequent rally now threatening a breakout of multi-month downtrend resistance at the March open / high-day close at 1733/36.
A newly added ascending pitchfork formation may be in play here and puts the advance at near-term uptrend resistance at the 75% parallel today. Key resistance objectives remain at the 1764/67 Fibonacci confluence with a breach / close above the February opening-range lows at 1785 needed to suggest a more significant reversal is underway.
Gold Price Chart - XAU/USD 120min
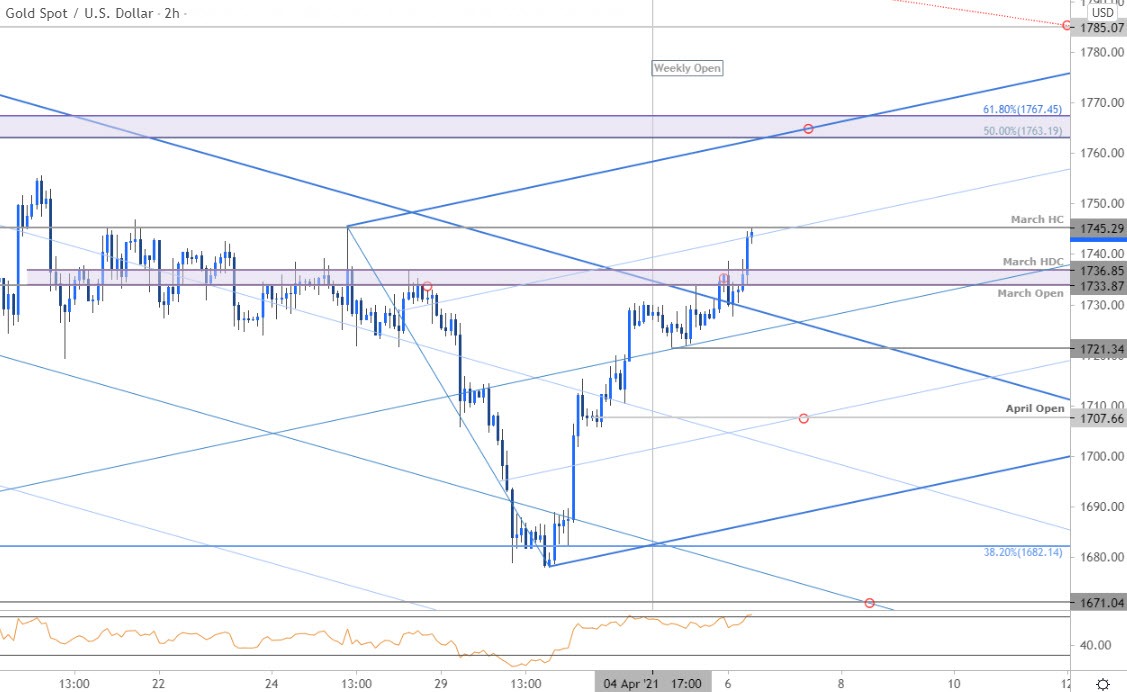
Notes: A closer look at Gold price action shows XAU/USD testing resistance at the March high-close here at 1745. Weekly-open support at 1728 backed by the opening-range low at 1721- ultimately a break / close below the monthly open at 1707 would be needed to mark resumption of the broader downtrend with such a scenario exposing 1682, 1671 and critical support at the 100% extension at 1649.

Bottom line: Gold is threatening a larger breakout here into the April open with price now testing initial resistance. From at trading standpoint, immediate risk is for a move higher while above the weekly open but look to reduce long-exposure / raise protective stops on a stretch towards 1764/67 – be on the lookout for topside exhaustion ahead of / into this zone. Losses should be limited to the monthly open IF price is indeed heading higher above 1785 needed to suggest a more significant low was registered last month. Review my latest Gold Weekly Price Outlook for a closer look at the longer-term XAU/USD technical trading levels.
For a complete breakdown of Michael’s trading strategy, review his Foundations of Technical Analysis series on Building a Trading Strategy
Gold Trader Sentiment – XAU/USD Price Chart

- A summary of IG Client Sentiment shows traders are net-long Gold- the ratio stands at +4.70 (82.46% of traders are long) – typically bearishreading
- Long positions are2.23% higher than yesterday and 3.79% lower from last week
- Short positions are 0.76% higher than yesterday and 34.81% higher from last week
- We typically take a contrarian view to crowd sentiment, and the fact traders are net-long suggests Gold prices may continue to fall. Traders are more net-long than yesterday but less net-long from last week. The combination of current positioning and recent changes gives us a further mixed Gold trading bias from a sentiment standpoint.
| Change in | Longs | Shorts | OI |
| Daily | 7% | -6% | 1% |
| Weekly | 12% | -10% | 1% |
---
Active Technical Setups
- Canadian Dollar Outlook: USD/CAD Plunges into April- Support Ahead
- Mexican Peso Outlook: USD/MXN Plummets into Support– Bears Face NFP
- US Dollar Outlook: DXY Breakout Vulnerable into April Open / NFP
- Euro Outlook: EUR/USD Plummets Towards 1.17- Bear March into April
- Written by Michael Boutros, Technical Strategist with DailyFX
Follow Michael on Twitter @MBForex


