


Sterling Technical Price Outlook: GBP/USD Weekly Trade Levels
- Sterling technical trade level update – Weekly Chart
- GBP/USD rebound vulnerable while below yearly open resistance
- Key resistance 1.3175-1.3250 – Critical support 1.2693-1.2754
The British Pound is up more than 0.4% against the US Dollar into the weekly open but keeps Sterling within the confines of a key price range we’ve been tracking for weeks now. The weekly rebound may have some steam near-term but the broader risk still remains tilted to the downside with the immediate focus on a break of a key price range. These are the updated targets and invalidation levels that matter on the GBP/USD weekly technical chart. Review my latest Strategy Webinar for an in-depth breakdown of this Cable trade setup and more.
Sterling Price Chart - GBP/USD Weekly

Chart Prepared by Michael Boutros, Technical Strategist; GBP/USD on Tradingview
Notes: In my last Sterling Weekly Price Outlook we noted that GBP/USD was, “testing a critical medium-term support zone and the immediate focus is on inflection off this threshold.” The zone in focus was 1.2693-1.2754- a region defined by the 38.2% retracement of the yearly range, the 2018 low-week close and the 2019 objective yearly open. A rebound off this key zone in late September gathered pace into the October open with Sterling rallying more than 3.2% off the recent lows.
The recovery failed last week at the 50% retracement (high registered at 1.3084) - a pullback off this mark keeps the focus on a break of the 1.2693-1.3080 range for guidance with the broader weighted to the downside while below critical resistance at 1.3175/1.3250- a region defined by the 61.8% Fibonacci retracement of the September range / 2018 decline and the 2020 yearly open. A break / close below key support at 1.2693-1.2754 is needed to mark resumption of the broader downtrend with such a scenario exposing the June low-day close / 2018 low at 1.2478/81.
For a complete breakdown of Michael’s trading strategy, review his Foundations of Technical Analysis series on Building a Trading Strategy
Bottom Line:Last week’s British Pound price reversal keeps the focus on a break of the recent range for guidance with the broader risk still lower below the yearly open. From a trading standpoint, “the risk remains for some recovery off this mark but look for topside exhaustion ahead of 1.3175 IF price is heading lower with a break / close sub-1.2693 needed to shift the broader focus back to the downside. I’ll publish and updated Sterling Price Outlook once we get further clarity on the near-term GBP/USD technical trade levels.”

Sterling Trader Sentiment - GBP/USD Price Chart

- A summary of IG Client Sentiment shows traders are net-short GBP/USD - the ratio stands at -1.57 (38.96% of traders are long) – bullish reading
- Long positions are1.85% lower than yesterday and 16.77% lower from last week
- Short positions are29.90% higher than yesterday and 0.24% higher from last week
- We typically take a contrarian view to crowd sentiment, and the fact traders are net-short suggests GBP/USD prices may continue to rise. Traders are further net-short than yesterday and last week, and the combination of current positioning and recent changes gives us a stronger GBP/USD-bullish contrarian trading bias from a sentiment standpoint.
| Change in | Longs | Shorts | OI |
| Daily | 3% | -7% | -3% |
| Weekly | 4% | -10% | -5% |
---
Key UK / US Data Releases
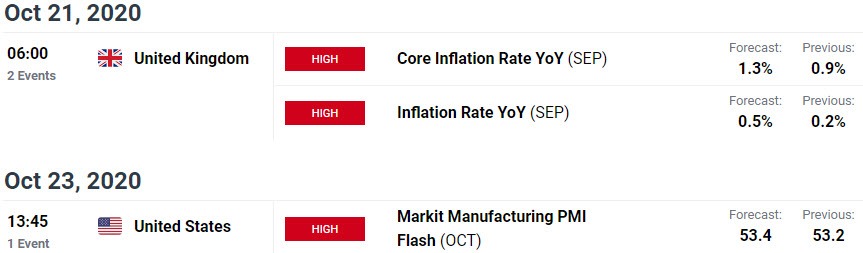
Economic Calendar - latest economic developments and upcoming event risk.
Previous Weekly Technical Charts

--- Written by Michael Boutros, Technical Currency Strategist with DailyFX
Follow Michael on Twitter @MBForex


