


Sterling Technical Price Outlook: GBP/USD Trade Levels
- Sterling technical trade level update – Daily & Intraday Charts
- GBP/USD testing major technical resistance – rally vulnerable near-term sub-1.3311
- Monthly open support 1.3080 – weakness beyond would risk larger correction in British Pound
The British Pound rallied nearly 0.9% against the US Dollar this week with GBP/USD once again testing a critical resistance barrier. While the broader outlook remains constructive, the immediate advance remains vulnerable while below this key threshold and we’re looking for a reaction. These are the updated targets and invalidation levels that matter on the GBP/USD price charts. Review my latest Weekly Strategy Webinar for an in-depth breakdown of this Cable trade setup and more.
Sterling Price Chart – GBP/USD Daily

Chart Prepared by Michael Boutros, Technical Strategist; GBP/USD on Tradingview
Technical Outlook: Sterling is trading into a critical resistance zone we’ve been tracking for months now at 1.3245-1.3311- a region defined by the 61.8% Fibonacci retracement of the 2018 decline, the objective 2020 yearly open and the 100% extension of the March advance. The rally remains vulnerable while below this threshold with daily RSI highlighting ongoing bearish divergence into these highs. Pitchfork support converges on the monthly open at 1.3080 with a break / close below the August opening-range lows at 1.2980 needed to suggest a larger correction is underway.
Sterling Price Chart – GBP/USD 120min
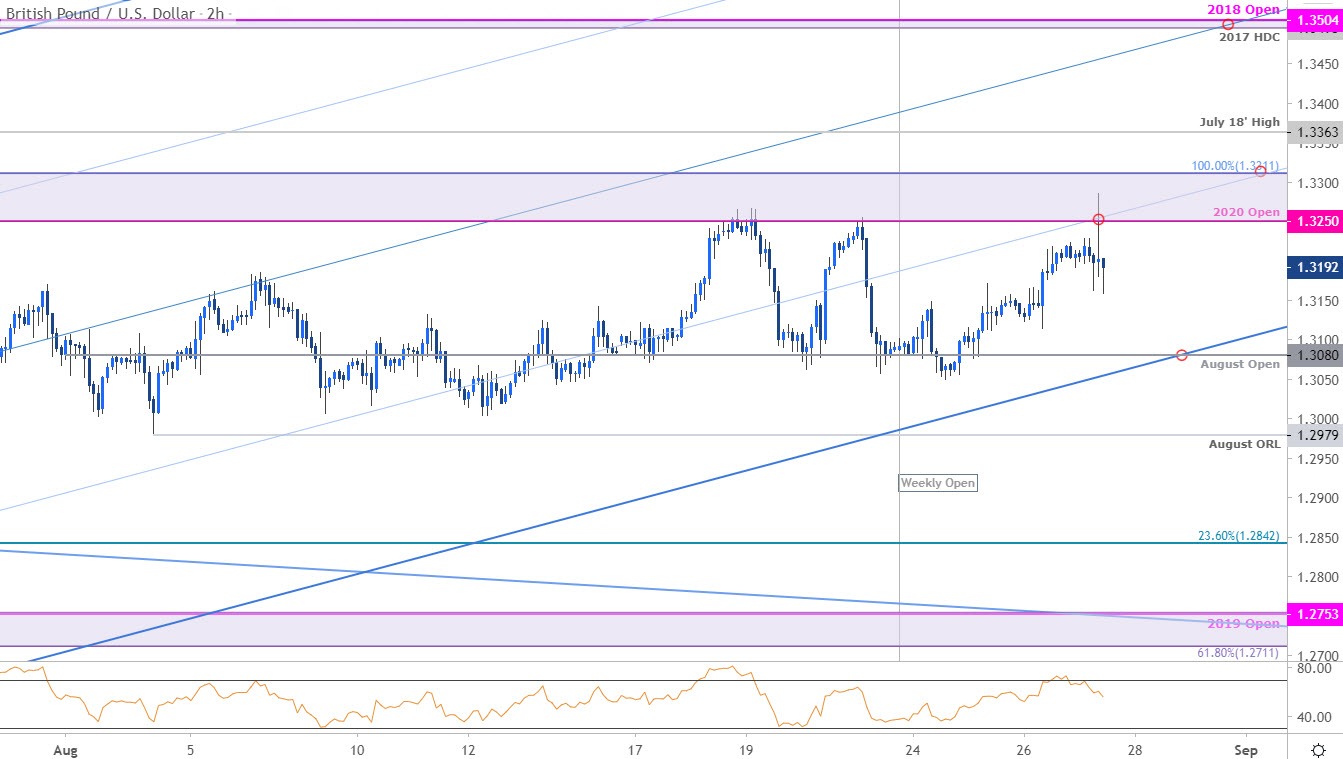
Notes: A closer look at Sterling price action shows GBP/USD ranging just below this key resistance zone with another attempt failing today in New York. A topside breach from here exposes the July 2018 swing high at 1.3363 backed by critical resistance at the 2017 high-day close / 2018 open at the 1.35-handle – look for a larger reaction there IF reached. A break below the monthly range lows would shift the focus back towards the 23.6% retracement of the March rally at 1.2842 backed by the 61.8% retracement / 2019 yearly open at 1.2711/53- area of interest for possible downside exhaustion IF reached.

Bottom line: A multi-month rally in the British Pound takes Sterling into a key technical resistance zone. From a trading standpoint, a good region to reduce long-exposure / raise protective stops – be on the lookout for possible topside exhaustion while below this zone with a break below the monthly open / trendline support risking a larger Dollar recovery. Ultimately a larger correction may offer more favorable entries with a breach / close above 1.3311 needed to mark resumption of the broader uptrend. Review my latest British Pound Weekly Price Outlook for a closer look at the longer-term GBP/USD technical trade levels.
For a complete breakdown of Michael’s trading strategy, review his Foundations of Technical Analysis series on Building a Trading Strategy
Sterling Trader Sentiment – GBP/USD Price Chart

- A summary of IG Client Sentiment shows traders are net-short GBP/USD - the ratio stands at -1.97 (33.63% of traders are long) – bullish reading
- Long positions are10.26% lower than yesterday and 4.08% lower from last week
- Short positions are7.44% higher than yesterday and 15.73% higher from last week
- We typically take a contrarian view to crowd sentiment, and the fact traders are net-short suggests GBP/USD prices may continue to rise. Traders are further net-short than yesterday and last week, and the combination of current positioning and recent changes gives us a stronger GBP/USD-bullish contrarian trading bias from a sentiment standpoint.
| Change in | Longs | Shorts | OI |
| Daily | 3% | -7% | -3% |
| Weekly | 4% | -10% | -5% |
---
Key UK / US Data Releases

Economic Calendar - latest economic developments and upcoming event risk.
Active Trade Setups
- Canadian Dollar Outlook: USD/CAD Coils– Loonie Breakout Imminent
- Japanese Yen Technical Outlook: USD/JPY Slams into August Range Lows
- Australian Dollar Forecast: AUD/USD Seven-Week Rally at Risk
- Gold Price Outlook: XAU/USD Crashes – Reversal or Retracement?
- Dollar vs Mexican Peso Price Outlook: USD/MXN Range Breakout Imminent
- Euro Dollar Outlook: EUR/USD Breakout Faces Key Fibonacci Resistance
- Written by Michael Boutros, Currency Strategist with DailyFX
Follow Michael on Twitter @MBForex


