


Canadian Dollar Technical Price Outlook: USD/CAD Weekly Trade Levels
- Canadian Dollar updated technical trade levels - Weekly Chart
- USD/CAD three-week rally fails at technical confluence
- Focus is on a reaction at resistance 1.3389 – support now 1.3157
The Canadian Dollar is poised to snapped a three-week losing streak against the US Dollar with USD/CAD pulling back from confluence resistance. The immediate focus is on a reaction off this mark with the broader March down-trend vulnerable heading into the October open. These are the updated targets and invalidation levels that matter on the USD/CAD weekly technical price chart. Review my latest Strategy Webinar for an in-depth breakdown of this Loonie technical setup and more.
Canadian Dollar Price Chart – USD/CAD Weekly
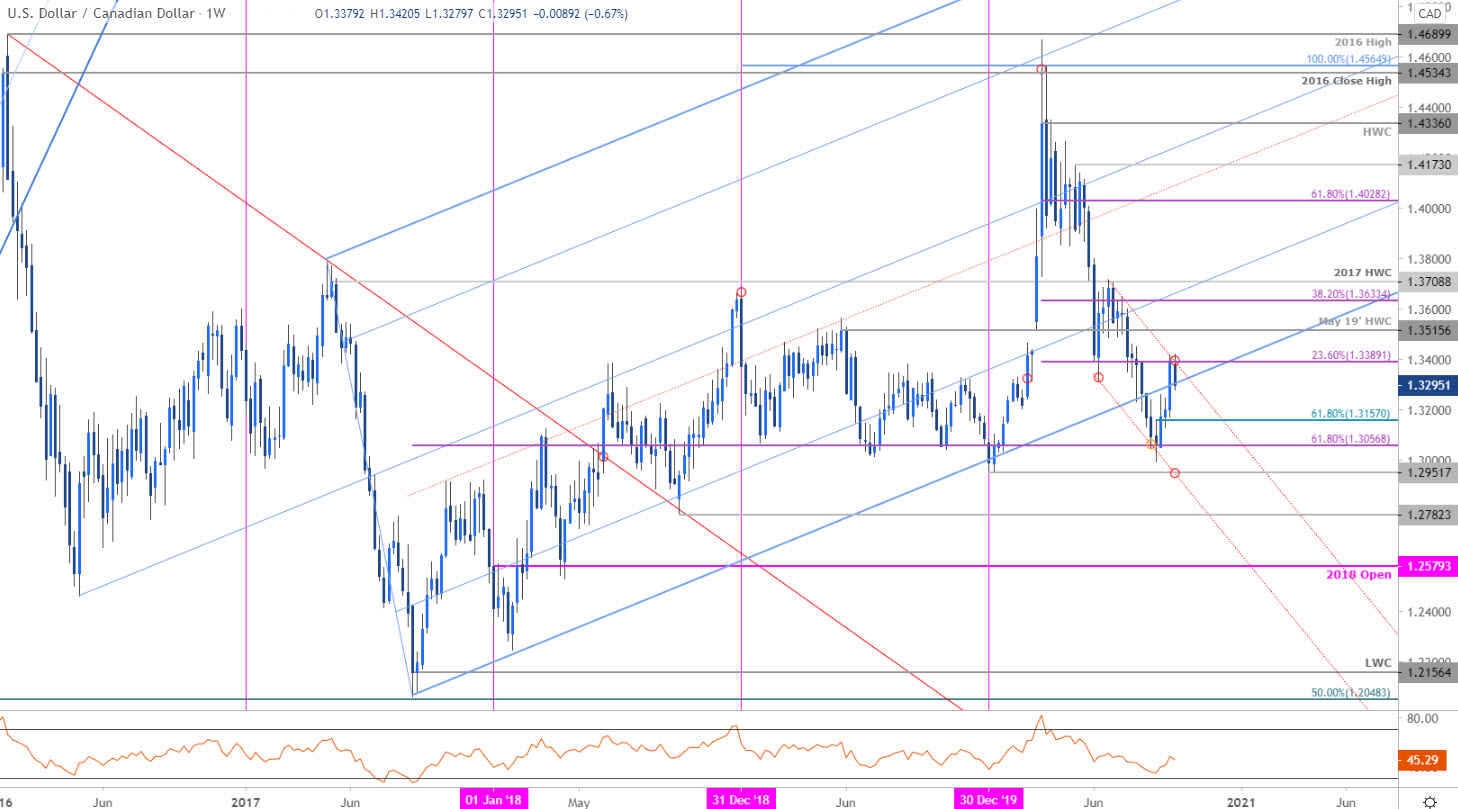
Chart Prepared by Michael Boutros, Technical Strategist; USD/CAD on Tradingview
Notes: In last month’s Canadian Dollar Weekly Price Outlook we noted that USD/CAD had, “responded to key Fibonacci support early in the month and while further topside may be likely near-term, the broader risk remains weighted to the downside.” A three-week rally took prices into confluence resistance last week at the June trendline / 23.6% retracement at 1.3389 with Loonie paring a portion off the losses this week.
The focus heading into the start of October trade is on a reaction off this mark with the September rally at risk while below this key resistance zone. Initial weekly support now rests at ~1.3250 backed by the 61.8% Fibonacci retracement at 1.3157- ultimately a break / close below the longer-term 61.8% retracement of the 2017 advance / August low-week close at 1.3056/60 would be needed to mark resumption towards the yearly opening-range lows at 1.2951 and beyond.
A topside breach / close above this confluence zone would suggest a more significant low was registered in August with such a scenario exposing subsequent topside resistance objectives at the May 2019 high-week close at 1.3515 and the 38.2% retracement of the March decline at 1.3633. A close above the 2017 high-week close at 1.3709 would ultimately be needed to put the broader long-bias back into focus.

Bottom line: USD/CAD has responded to confluence resistance and heading into the October open the focus remains on a reaction / inflection off this key threshodl. From at trading standpoint, look for support / an exhaustion low ahead of 1.3157 IF price is indeed heading higher with a breach / close above this week’s highs needed to suggest a larger Dollar recovery is underway. Review my latest Canadian Dollar Price Outlook for a closer look at the near-term USD/CAD technical trade levels.
For a complete breakdown of Michael’s trading strategy, review his Foundations of Technical Analysis series on Building a Trading Strategy
Canadian Dollar Trader Sentiment – USD/CAD Price Chart
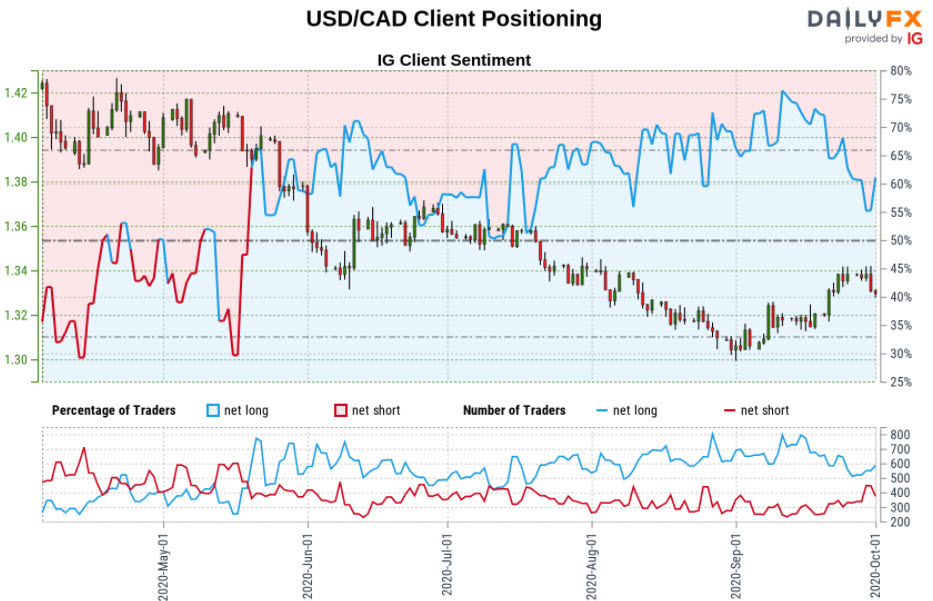
- A summary of IG Client Sentiment shows traders are net-long USD/CAD - the ratio stands at +1.78 (64.07% of traders are long) – bearish reading
- Long positions are11.27% higher than yesterday and 3.17% lower from last week
- Short positions are18.18% lower than yesterday and 1.98% higher from last week
- We typically take a contrarian view to crowd sentiment, and the fact traders are net-long suggests USD/CAD prices may continue to fall. Traders are more net-long than yesterday but less net-long from last week. The combination of current positioning and recent changes gives us a further mixed USD/CAD trading bias from a sentiment standpoint.
| Change in | Longs | Shorts | OI |
| Daily | -45% | 31% | -7% |
| Weekly | -11% | -7% | -8% |
---
Key US / Canada Data Releases
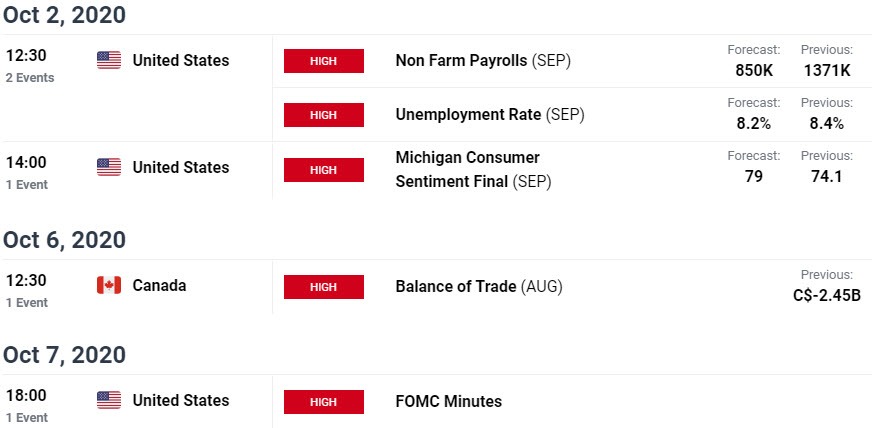
Economic Calendar - latest economic developments and upcoming event risk.
Previous Weekly Technical Charts
- British Pound (GBP/USD)
- Gold (XAU/USD)
- Crude Oil (WTI)
- US Dollar (DXY)
- Euro (EUR/USD)
- Japanese Yen (USD/JPY)
--- Written by Michael Boutros, Technical Currency Strategist with DailyFX
Follow Michael on Twitter @MBForex


