


Crude Oil Technical Forecast: WTI Weekly Trade Levels
- Crude Oil updated technical trade levels – Weekly Chart
- WTI ranges below long-term downtrend resistance– risk for further losses while below 43
- New to Oil Trading? Get started with this Free How to Trade Oil-Beginners Guide
Oil prices are poised to snap a two-week losing streak after stalling at a key resistance range for nearly seven-weeks. The recovery keeps price below this critical threshold and leaves the rally vulnerable while below long-term downtrend resistance. These are the updated targets and invalidation levels that matter on the oil price weekly chart. Review my latest Strategy Webinar for an in-depth breakdown of this crude oil price setup and more.
Crude Oil Price Chart – WTI Weekly
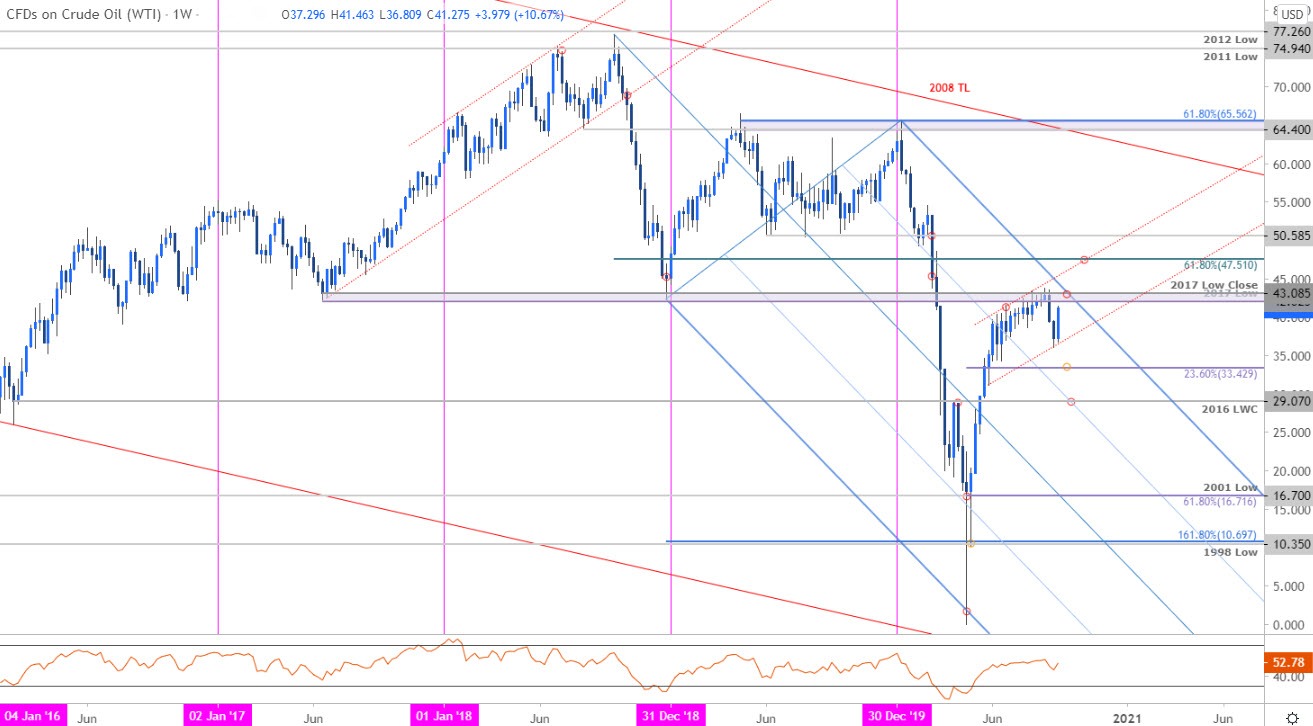
Chart Prepared by Michael Boutros, Technical Strategist; Crude Oil (WTI) on Tradingview
Notes:Crude oil is trading within the confines of a descending pitchfork formation extending off the 2018 / 2020 highs with price trading just below the upper parallel. The April rally failed at a critical resistance zone into the close of August trade at 42.02/43.08- a region defined by the 2017 low / low-week close. Note that the upper parallel converges on this range in the weeks ahead and further highlights the technical significance of this key resistance zone with the multi-month rally at risk while into this threshold.
Initial weekly support rests with the late-May channel line (currently ~37) with a break below risking a larger correction towards subsequent objectives at the 23.6% retracement of the April rally at 33.42 and the 2016 low-week close at 29.07- an area of interest for possible downside IF reached. Ultimately, a breach / close above the 61.8% Fibonacci retracement of the 2018 decline at 47.51 is needed to validate a larger breakout / trend reversal is underway.

Bottom line:Oil prices remain vulnerable while below critical resistance at 42.02/43.08. From a trading standpoint, be on the lookout for possible topside exhaustion ahead of this zone with a break below channel support needed to shift the medium-term focus lower. Ultimately, a larger correction may offer more favorable opportunities with a topside breach above 47.51 needed to keep the April rally viable.
For a complete breakdown of Michael’s trading strategy, review his Foundations of Technical Analysis series on Building a Trading Strategy
Crude Oil Trader Sentiment – WTI Price Chart
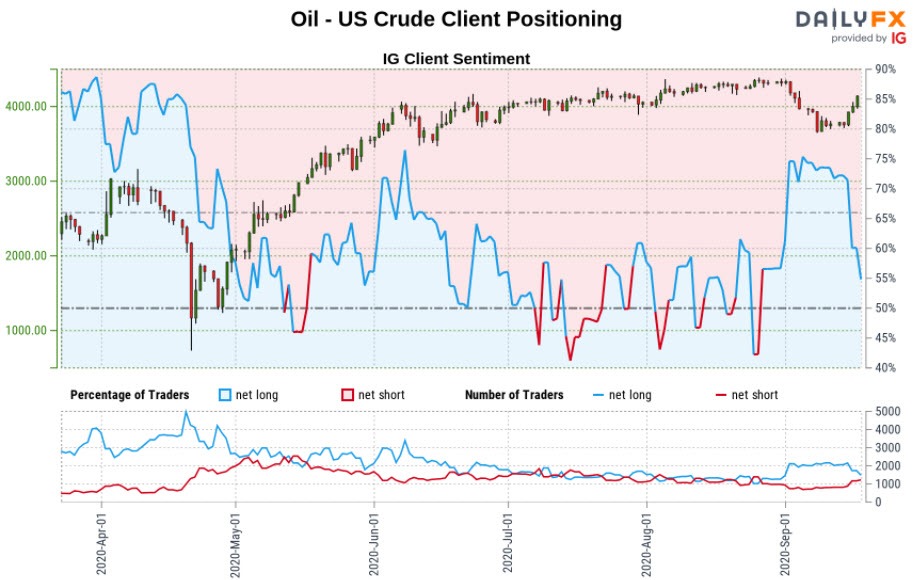
- A summary of IG Client Sentiment shows traders are net-long crude oil - the ratio stands at +1.26 (55.79% of traders are long) – weak bearish reading
- Long positions are 10.77% lower than yesterday and 29.54% lower from last week
- Short positions are5.23% higher than yesterday and 34.56% higher from last week
- We typically take a contrarian view to crowd sentiment, and the fact traders are net-long suggests Oil - US Crude prices may continue to fall. Yet traders are less net-long than yesterday and compared with last week. Recent changes in sentiment warn that the current Oil - US Crude price trend may soon reverse higher despite the fact traders remain net-long.
| Change in | Longs | Shorts | OI |
| Daily | 2% | -10% | -2% |
| Weekly | 28% | -33% | 3% |
---
Previous Weekly Technical Charts
- US Dollar (DXY)
- Euro (EUR/USD)
- Canadian Dollar (USD/CAD)
- Gold (XAU/USD)
- Japanese Yen (USD/JPY)
- New Zealand Dollar (NZD/USD)
- Australian Dollar (AUD/USD)

--- Written by Michael Boutros, Technical Strategist with DailyFX
Follow Michael on Twitter @MBForex


