


US Dollar Technical Price Outlook: DXY Weekly Trade Levels
- US Dollar technical trade level update – Daily & Intraday Charts
- USD breaks below multi-week consolidation range / monthly range lows
- DXY risk is lower while below May open- initial support targets in view
The US Dollar plunged more than 1.6% this week with the DXY breaking below a multi-week consolidation formation in price. The second consecutive weekly decline takes the greenback nearly 5% off the yearly highs with price now approaching initial support objectives - we’ll be looking for a reaction down here heading into the June open. These are the updated technical targets and invalidation levels that matter on the US Dollar Index (DXY) weekly price chart. Review my latest Strategy Webinar for an in-depth breakdown of this US Dollar trade setups and more.
US Dollar Index Price Chart – DXY Weekly
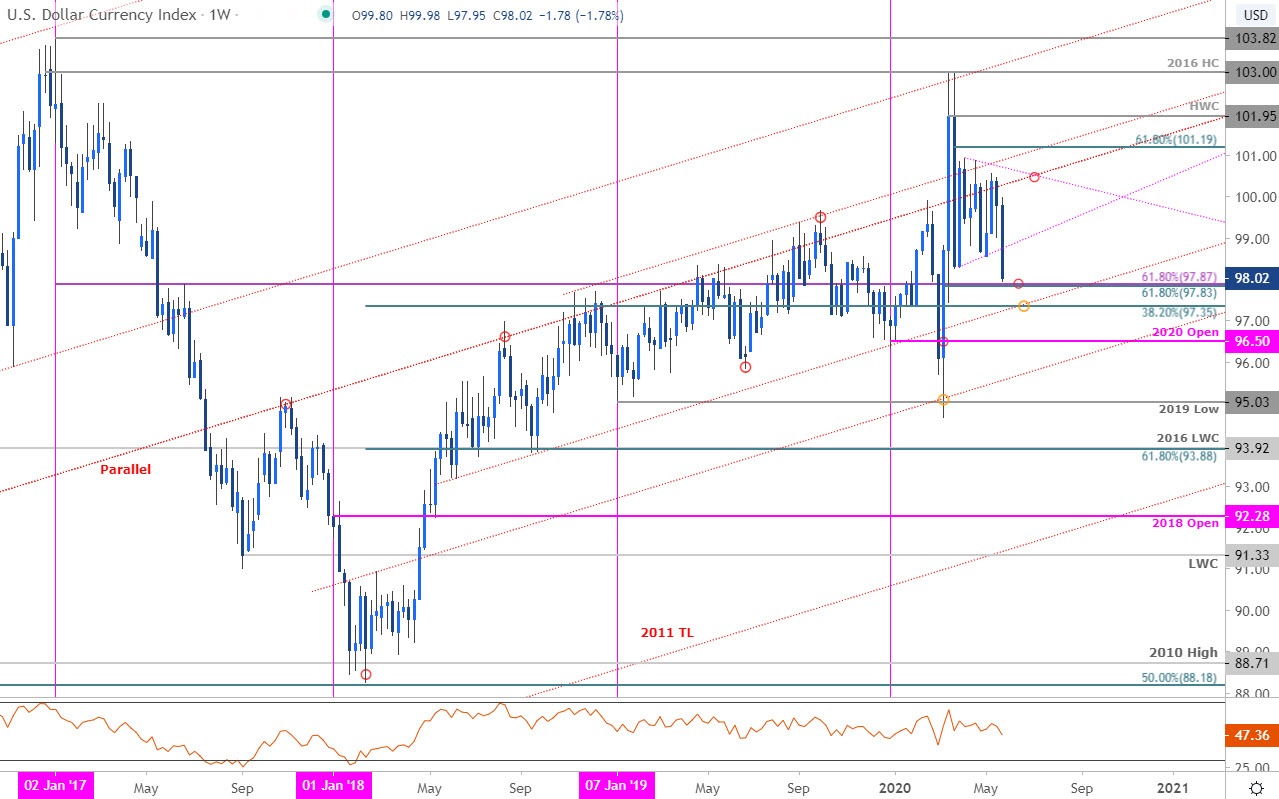
Chart Prepared by Michael Boutros, Technical Strategist; US Dollar Index on Tradingview
Notes: In last month’s US Dollar Weekly Price Outlook we highlighted the risk for exhaustion in the index after the March rally with, “Support objectives unchanged at the 61.8% Fibonacci confluence at 97.83/87– ultimately a break / close below 97.35 would be needed to suggest a more significant high was registered.” The dollar fell into a consolidation range for nearly nine weeks before breaking lower yesterday with the decline now taking the index within striking distance of initial support.
Initial resistance now back former slope support (currently ~98.80s) backed by the May open at 99.13- both zones of interest for possible topside exhaustion IF reached. Broader bearish invalidation now lowered to the highlighted trendline confluence near ~100.50s.
For a complete breakdown of Michael’s trading strategy, review his Foundations of Technical Analysis series on Building a Trading Strategy
Bottom line: The Dollar Index has broken below a multi-week consolidation / the May opening-range lows and keeps the focus lower heading into June. That said, the decline is now approaching initial support objectives that could interrupt the decline. From at trading standpoint, look to reduce short exposure / lower protective stops on a stretch into 97.83/87 – look for a reaction there with a break below the 97.35 needed to challenge the yearly open at 96.50.

---
Key US Data Releases

Economic Calendar - latest economic developments and upcoming event risk.
Previous Weekly Technical Charts
- Canadian Dollar (USD/CAD)
- Euro (EUR/USD)
- Gold (XAU/USD)
- Mexican Peso (USD/MXN)
- Japanese Yen (USD/JPY)
- Sterling (GBP/USD)

--- Written by Michael Boutros, Technical Strategist with DailyFX
Follow Michael on Twitter @MBForex


