


Sterling, GBPUSD Talking Points:
- The British Pound has finally caught a bounce after a three-week-pattern of weakness.
- GBPUSD is moving out of oversold territory on the Daily chart. The last time this happened in August of 2018 led to a 600+ pip movement.
- DailyFX Forecasts are published on a variety of currencies such as Gold, the US Dollar or the Euro and are available from the DailyFX Trading Guides page. If you’re looking to improve your trading approach, check out Traits of Successful Traders. And if you’re looking for an introductory primer to the Forex market, check out our New to FX Guide.
Do you want to see how retail traders are currently trading the US Dollar? Check out our IG Client Sentiment Indicator.
GBPUSD Bears Take a Break as Daily RSI Moves out of Oversold
Last week saw a punishing move continue in GBPUSD as the pair pushed down to fresh four-month lows, crossing a big zone of prior support in the process. The headlines were not friendly to GBP bulls, as continued discord around Brexit increased the opacity around what’s become an acrimonious theme in global markets. And while this week brings perhaps even less clarity, as we don’t even know who will be leading the UK through Brexit; a bit of hope has developed on the long side of the British Pound, driven by an oversold reading in GBPUSD combined with the recent resignation announcement of PM, Theresa May.
At this point, GBPUSD is pushing out of oversold territory on the Daily chart. The last time this happened in August of last year, prices inclined by more than 600 pips over the next five weeks; even with the worrisome backdrop remaining around the Brexit theme at the time.
GBPUSD Daily Price Chart

Chart prepared by James Stanley
GBPUSD: Short-Term Resistance Showing at Prior Support
At this point, near-term price action is holding resistance around a key zone of prior support. This area has three different Fibonacci levels of note, with the 1.2671 price as the 23.6% Fibonacci retracement of the ‘Brexit move’ in the pair. The level of 1.2705 helped to hold yesterday’s swing-high, and that’s the 14.4% retracement of the 2014-2016 major move. And at 1.2721, we have the 14.4% retracement of last year’s sell-off. This zone held support in August and October of last year, only succumbing to selling pressure in December as risk-aversion themes were running at near-full blast. But, as risk recovered after the 2019 open, prices pushed back-above this key zone and have remained there until last week’s test below.
GBPUSD Eight-Hour Price Chart
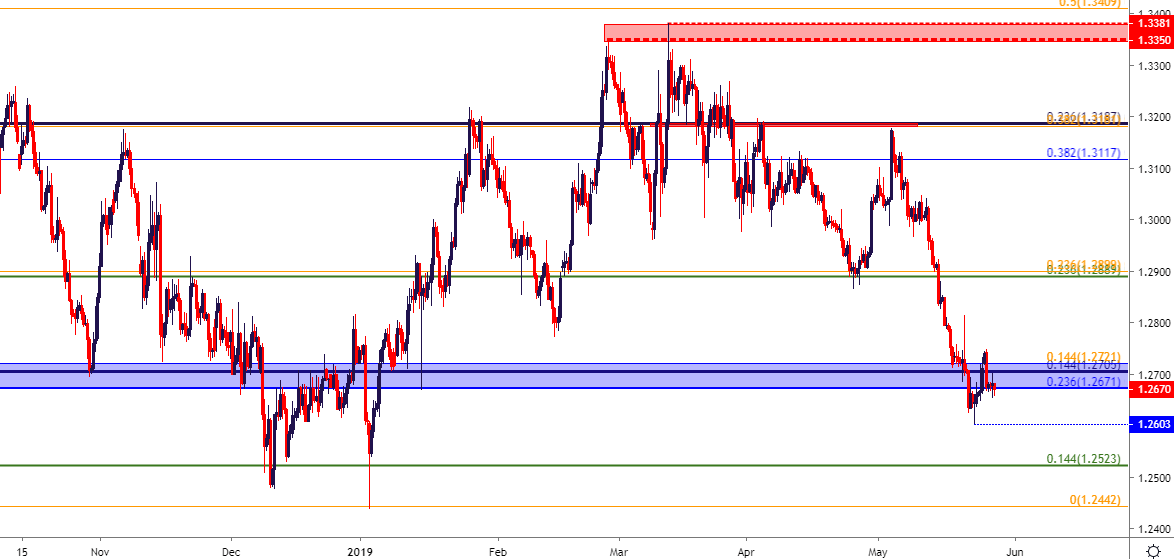
Chart prepared by James Stanley
GBPUSD: Beware Bear Traps
Resistance at a prior area of key support is, in and of itself, a fairly attractive observation for bearish strategies. Context, however, remains important, as last week’s test of fresh lows comes amidst an oversold situation in the British Pound that may be due for a deeper retracement. Of note, the bearish momentum that punctuated the backdrop for much of May trade has been broken. Prices appear to be trying to cauterize higher-low support.
And while this may not necessarily get GBPUSD bulls excited just yet, it may be enough to put bearish strategies on the sidelines until a deeper retracement might show. This can place emphasis on deeper resistance potential; such as 1.2825 or perhaps even as deep as the confluent 1.2900 handle, which helped to arrest an aggressive decline previously in April. That area syncs well with the 50% retracement of the May sell-off, so if prices do break above that key zone on the chart, bullish backdrops may become a bit more attractive.
GBPUSD Four-Hour Price Chart
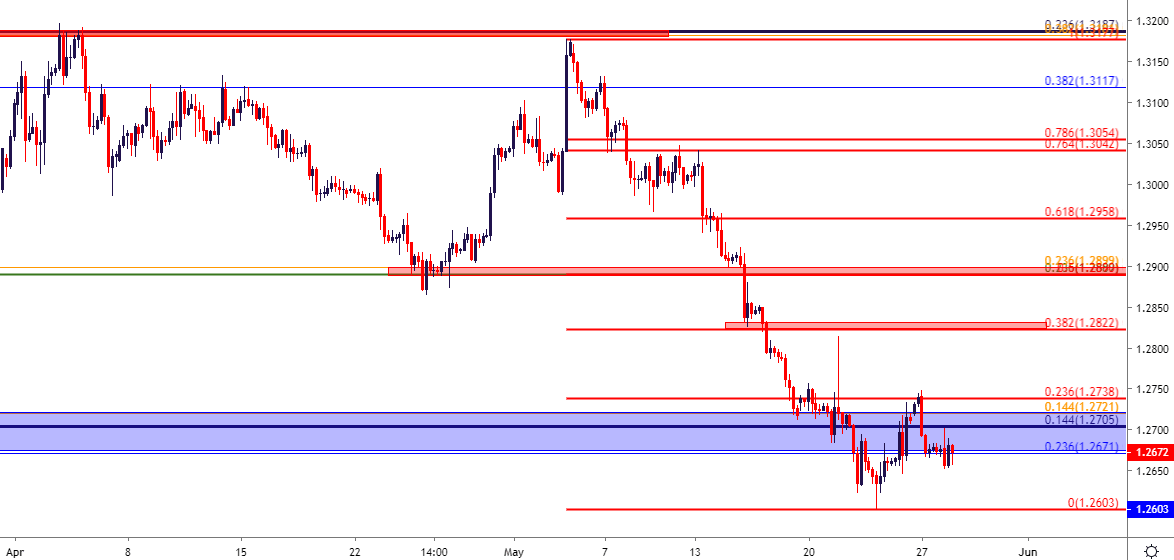
Chart prepared by James Stanley
To read more:
Are you looking for longer-term analysis on the U.S. Dollar? Our DailyFX Forecasts have a section for each major currency, and we also offer a plethora of resources on Gold or USD-pairs such as EUR/USD, GBP/USD, USD/JPY, AUD/USD. Traders can also stay up with near-term positioning via our IG Client Sentiment Indicator.
Forex Trading Resources
DailyFX offers an abundance of tools, indicators and resources to help traders. For those looking for trading ideas, our IG Client Sentiment shows the positioning of retail traders with actual live trades and positions. Our trading guides bring our DailyFX Quarterly Forecasts and our Top Trading Opportunities; and our real-time news feed has intra-day interactions from the DailyFX team. And if you’re looking for real-time analysis, our DailyFX Webinars offer numerous sessions each week in which you can see how and why we’re looking at what we’re looking at.
If you’re looking for educational information, our New to FX guide is there to help new(er) traders while our Traits of Successful Traders research is built to help sharpen the skill set by focusing on risk and trade management.
--- Written by James Stanley, Strategist for DailyFX.com
Contact and follow James on Twitter: @JStanleyFX


