


GBP/USD Talking Points:
- The British Pound has had an interesting day already, first bouncing higher after the release of stronger-than-expected inflation numbers from the month of August. This was then followed by a full reversal of those prior gains as negative Brexit headlines began to show. At this point, prices have stabilized while trying to build support around a key Fibonacci level at 1.3117.
- This may be setting up a bull trap, however, and buyers might want to wait for a deeper pullback before looking to take on top-side exposure: And there is another side to the argument, as prices have begun to test below the bullish trend-line that can be taken from the lows over the past two weeks. As we previously pointed out – this may be part of a rising wedge formation that will often be looked to for bearish reversals. It’s still early, and traders would likely want to proceed with a bullish bias until lower-lows begin to show, but that bearish potential is building and, if coupled with more negative Brexit headlines, could soon provoke a bigger-picture reversal of the past month of strength in the pair.
- Quarterly Forecasts have just been updated, and the Q3 forecast for GBP/USD is available from the DailyFX Trading Guides Page. If you’re looking to improve your trading approach, check out Traits of Successful Traders. And if you’re looking for an introductory primer to the Forex market, check out our New to FX Guide.
Want to see how retail traders are currently trading GBP/USD? Click here for GBP/USD Sentiment.
GBP/USD Pop and Drop on CPI, Brexit Headlines
The topside move in GBP/USD has continued into another day as prices pushed up to 1.3213 earlier this morning. The level of 1.3213 was a swing-high from late-July, and this last came into play ahead of an aggressive bout selling that enveloped GBP/USD price action for the next three weeks. Eventually, this led to a test of the 23.6% Fibonacci retracement of the Brexit move at 1.2671, and this is where the declines finally ran into some lasting support that was able to shift the trend. In the month since that support has come into play, we’ve seen a bullish move that’s driven Cable back-above the key psychological level at 1.3000, and has brought the 38.2% retracement of that same Brexit move back into the picture.
GBP/USD Weekly Price Chart: Back to 38.2 After 78.6% April Top, 23.6% August Low
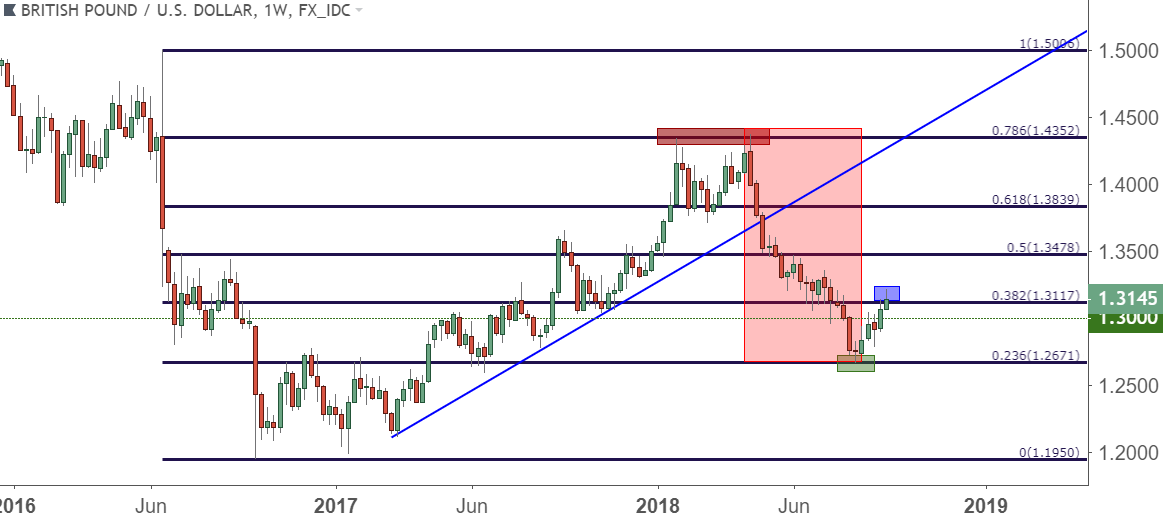
Chart prepared by James Stanley
As we’ve been following, the initial portion of this topside move appeared to emanate from short-cover. After a big support level came into play after a stern down-side run held in the pair to open the month of August, oversold conditions were showing on both weekly and monthly charts.
But – as we also pointed out, many new bullish trends begin as a short-squeeze; with bullish follow-thru taking-over as the context around a scenario begins to shift. This could be driven back to the late-August announcement from the EU’s Chief Negotiator, Michael Barnier, when he said that the EU would be open to a post-Brexit partnership with the UK. We mentioned at the time that this could be a game-changer for near-term GBP/USD price action, as prior fears of a Hard-Brexit or No Deal Brexit scenario were starting to get priced out of the market. And while the ride wasn’t smooth, that bullish bias continued to take-over until prices were back to testing the 1.3117 level late last week.
This level helped to mark last week’s high, and after this week’s open, prices quickly jumped-back above and we now have short-term support showing at this same level.
GBP/USD Four-Hour Price Chart: 38.2% Fibonacci Retracement Back in-Play
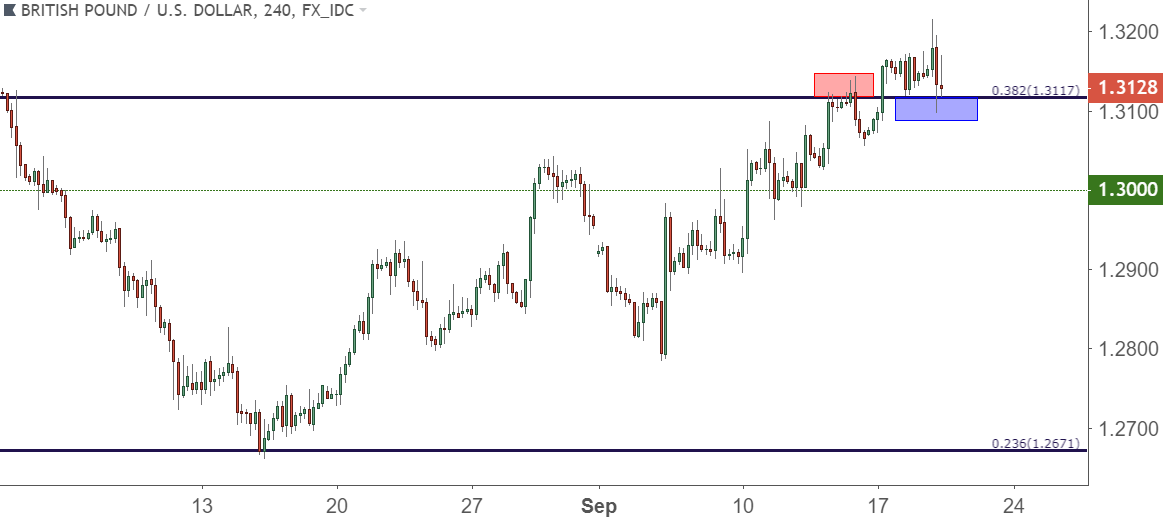
Chart prepared by James Stanley
This May Not Be the Support to Stage Bullish Plays From
While the trend in GBP/USD retains bullish qualities, the primary qualm at this point would be one of position on the charts, and price action may be setting up for a bullish trap of some kind, as higher-low support off of this key Fibonacci level would be almost too clean for comfort.
As we’ve been following, the simple fact that bulls were able to make ground above 1.3117 indicates their ability to continue driving-higher on the charts. And this can keep the door open for topside strategies, but traders would likely want to wait for a deeper pullback to a more adequate level of support that can open the door for more reasonable risk management mechanisms. The same zones that we looked at on Monday week apply, and we have two zones of support interest underneath 1.3117.
The first of these zones runs from prior swing highs/lows around the level of 1.3034-1.3065, and a bit below that, we have another support zone that runs from the prior swing point of 1.2962 up to the psychological level of 1.3000.
GBP/USD Two-Hour Price Chart
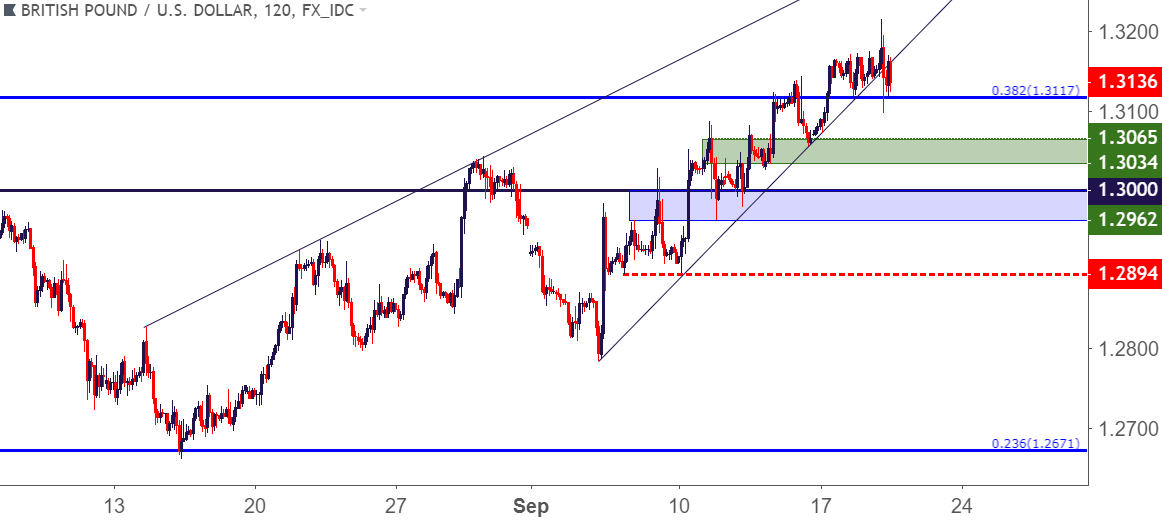
Chart prepared by James Stanley
The Bearish View
Given the dynamics around Brexit and, in-turn, GBP price action, we’d be remiss if we didn’t explore the other side of the argument at this point.
As we pointed out in late-August, the primary push point here appeared to be those comments from the EU’s Chief Negotiator; and as we alluded to, this helped to shift the trend in the pair. But – this is a liquid situation, and we’re far from out of the woods yet, so there does remain bearish potential particularly if those Hard Brexit fears come back to light. Given some of the negative comments that have shown so far on the day, this may have some potential over the next couple of weeks.
Going along with this thesis around reversal, we previously pointed out a rising wedge formation in GBP/USD. This is marked by higher-highs, but higher-lows coming in at an even faster pace. This type of formation will often be approached for reversal qualities, expecting the lack of enthusiasm at highs to, eventually, show-through to support. This morning’s volatility in GBP/USD has pushed prices below the support side of that formation, and this could be the very early stages of a possible bearish reversal in GBP/USD.
This is still early, and bearish themes would likely need some additional help from even more negative headlines around Brexit, which at this point certainly seems like a possibility; so this is something traders would want to keep a watchful eye on until more down-side pressure is seen in the pair.
For those looking to get bearish, a test below the 1.3000 psychological level could show that we’re seeing a shift in price action pronounced enough to have reversed the entirety of the past week of gains, and that could make the prospect of a deeper sell-off begin to look more likely.
GBP/USD Two-Hour Price Chart: Testing Below September Support Trend-Line

Chart prepared by James Stanley
To read more:
Are you looking for longer-term analysis on the U.S. Dollar? Our DailyFX Forecasts for Q1 have a section for each major currency, and we also offer a plethora of resources on USD-pairs such as EUR/USD, GBP/USD, USD/JPY, AUD/USD. Traders can also stay up with near-term positioning via our IG Client Sentiment Indicator.
Forex Trading Resources
DailyFX offers a plethora of tools, indicators and resources to help traders. For those looking for trading ideas, our IG Client Sentiment shows the positioning of retail traders with actual live trades and positions. Our trading guides bring our DailyFX Quarterly Forecasts and our Top Trading Opportunities; and our real-time news feed has intra-day interactions from the DailyFX team. And if you’re looking for real-time analysis, our DailyFX Webinars offer numerous sessions each week in which you can see how and why we’re looking at what we’re looking at.
If you’re looking for educational information, our New to FX guide is there to help new(er) traders while our Traits of Successful Traders research is built to help sharpen the skill set by focusing on risk and trade management.
--- Written by James Stanley, Strategist for DailyFX.com
Contact and follow James on Twitter: @JStanleyFX


