


GBP/USD Talking Points:
- GBP/USD continues to show strength with contribution coming from both sides of the pair: US Dollar weakness remains as the British Pound continues to claw-back prior losses.
- This week’s big item out of the UK is the release of August inflation numbers set for Wednesday morning; but fully expect Brexit headlines to continue to push price action in either direction.
- Quarterly Forecasts have just been updated, and the Q3 forecast for GBP/USD is available from the DailyFX Trading Guides Page. If you’re looking to improve your trading approach, check out Traits of Successful Traders. And if you’re looking for an introductory primer to the Forex market, check out our New to FX Guide.
Want to see how retail traders are currently trading GBP/USD? Click here for GBP/USD Sentiment.
The Cable Recovery Continues
The British Pound continues to claw back prior losses, as we’ve now erased the entirety of the early-August sell-off in GBP/USD. Last month started in a rocky manner for GBP after the Bank of England hiked rates for only the second time in the past decade. And while a rate move of that nature will generally bring on some element of strength, even if only temporary, no such relief was seen around Sterling at that rate decision. GBP/USD sold off for ten consecutive trading days in early-August, starting with that BoE Super Thursday rate decision on August the 2nd. Support finally began to show mid-month at a key Fibonacci level, taken from the 23.6% retracement of the ‘Brexit move’ in the pair.
That support has held, and GBP/USD prices have continued in their upward trajectory in the second-half of August and the early portion of September; and we’re now testing through the 38.2% retracement of the same Fibonacci study that helped to mark the April high and the August low in the pair.
GBP/USD Weekly Price Chart: 78.6 Top in April, 23.6 Bottom in August

Chart prepared by James Stanley
The Change
Something happened last month that continues to carry overtones of strength into the British Pound as we trade deeper into September, and this was something we looked at in the closing days of August. When the EU’s Chief Negotiator commented that the EU would be open to a post-Brexit partnership with the UK, we wrote that this had the potential to change the prior tone of persistent weakness in the British currency. We noted that it would be unlikely to be a smooth ride, as Brexit headlines continued to roil price action in both directions; but should buyers continue to defend higher-low support, that case for longer-term bullish continuation could begin to grow more attractive.
That’s what’s taken place, as we’ve seen a continuation of higher-highs and higher-lows hold up fairly well over the past two weeks. We last looked at the 1.3117 level, or the 38.2% retracement of the post-Brexit move, as a marker for bullish continuation potential. Now that prices have traded above that level, the prospect of higher low support could become a more attractive thesis for workable setups in the pair.
GBP/USD Four-Hour Price Chart
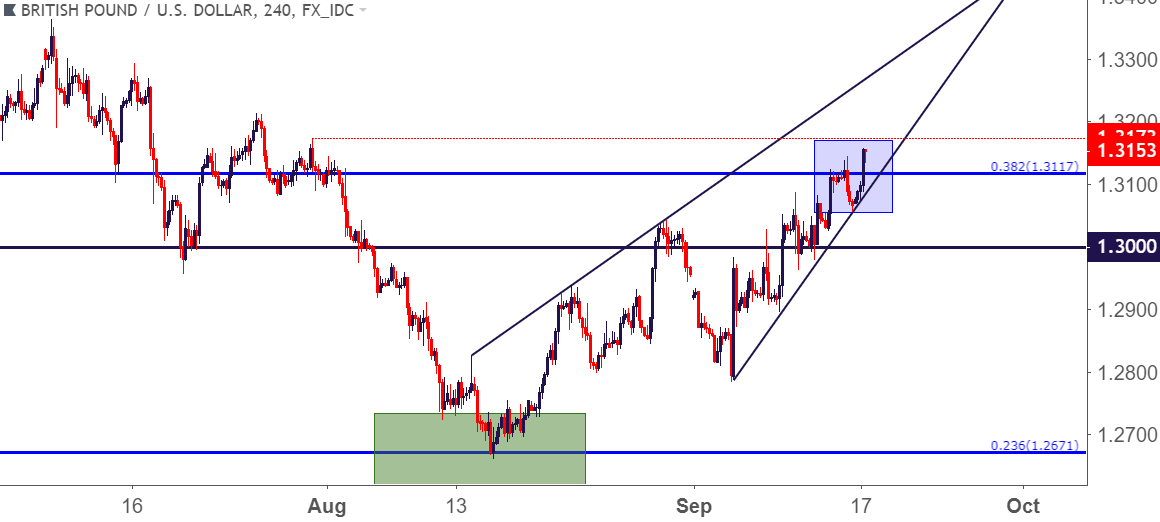
Chart prepared by James Stanley
UK CPI On Deck
The big item on the economic calendar this week out of the UK is the release of August inflation numbers. Coming into the summer, this was a huge push-point for the British Pound, as it was largely be used to source rate-hike expectations around the Bank of England. More recently, Brexit headlines have seemed to take precedence, but traders would likely want to keep a watchful eye on the release of this data point on Wednesday morning.
In July, we saw the first gain in CPI out of the UK in 2018. We came into the year with CPI at 3%, and this softened in February and March, which is a large part of the reason that prices began to reverse in April. But after printing at 2.4% for three consecutive months from April-June, July brought a bump-up to 2.5%. The expectation for this Wednesday’s release of August numbers is looking for a return to 2.4%; but if we do see a 2.5% print-or-above, we could be in for an additional dose of strength in the British currency.
UK Headline Inflation: Early-Year Drawdown Brings the Pain, but Can CPI Growth Bring the Gain?
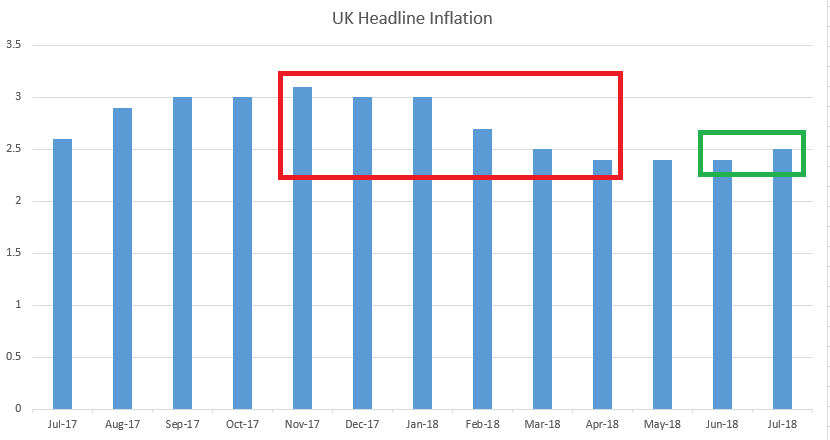
Chart prepared by James Stanley
GBP/USD Strategy
At this stage, performance in the US Dollar will likely bring a large bearing to GBP/USD price action, and we may be on the cusp of re-ignition of the Dollar’s nasty downtrend from last year. We discussed that in greater depth in this morning’s article on the matter entitled, USD Bears Hit Back: US Dollar Drops from Resistance at Prior Support.
But also notable is the potential for Brexit-driven headlines to continue driving volatility. So, we may not necessarily be in for a smooth ride, but given recent price action, the door would appear open for strategies of bullish continuation; and if we do get that grander breakdown in the US Dollar, the topside of GBP/USD could be that much more attractive.
On the chart below, we point out near-term support structure above last week’s swing low in GBP/USD. Each of these zones can be utilized for higher-low support in strategies of bullish continuation on the pair; and if we do break down below last week’s swing-low of 1.2894, traders would likely want to question the bullish trend as something likely would’ve changed in the backdrop.
GBP/USD Two-Hour Price Chart
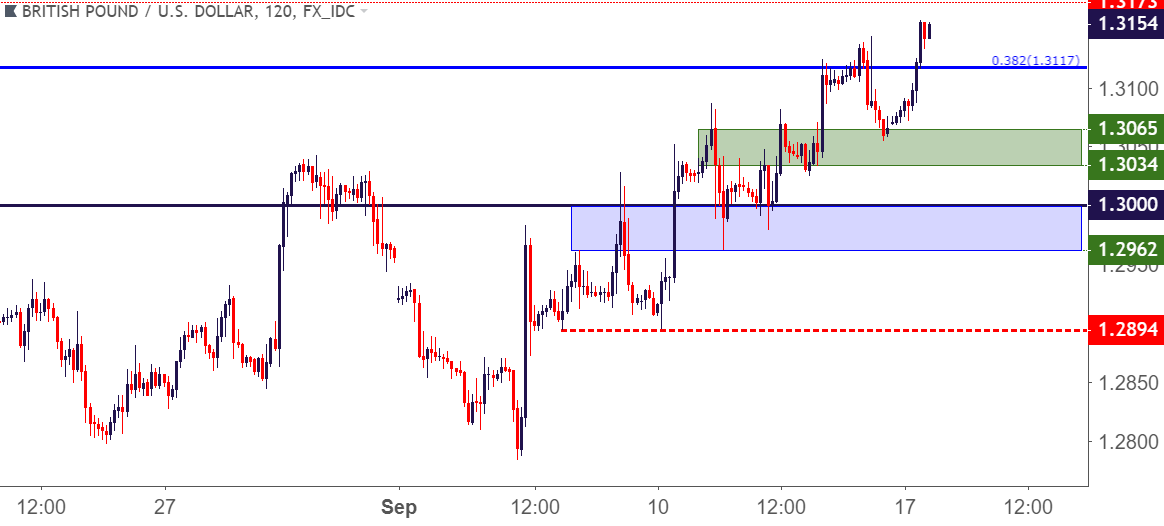
Chart prepared by James Stanley
To read more:
Are you looking for longer-term analysis on the U.S. Dollar? Our DailyFX Forecasts for Q1 have a section for each major currency, and we also offer a plethora of resources on USD-pairs such as EUR/USD, GBP/USD, USD/JPY, AUD/USD. Traders can also stay up with near-term positioning via our IG Client Sentiment Indicator.
Forex Trading Resources
DailyFX offers a plethora of tools, indicators and resources to help traders. For those looking for trading ideas, our IG Client Sentiment shows the positioning of retail traders with actual live trades and positions. Our trading guides bring our DailyFX Quarterly Forecasts and our Top Trading Opportunities; and our real-time news feed has intra-day interactions from the DailyFX team. And if you’re looking for real-time analysis, our DailyFX Webinars offer numerous sessions each week in which you can see how and why we’re looking at what we’re looking at.
If you’re looking for educational information, our New to FX guide is there to help new(er) traders while our Traits of Successful Traders research is built to help sharpen the skill set by focusing on risk and trade management.
--- Written by James Stanley, Strategist for DailyFX.com
Contact and follow James on Twitter: @JStanleyFX


