


Sterling (GBP) Talking Points:
- UK inflation jumps higher but BOE’s hands are tied.
- Media reports that the EU are looking at new Irish border proposals boost GBP.
The DailyFX Q3 GBP Forecast is available to download.
UK Price Pressures Soar, Need Dampening Down
UK CPI jumped to 2.7% from a prior month’s 2.5%, while core CPI rose to 2.1% from 1.9% with both readings beating expectations by 0.3%, a big upside beat and a problem for Bank of England governor Mark Carney. Inflation readings at this level will ring alarm bells at the central bank but their ability to hike interest rates at the November MPC meeting is severely curtailed by ongoing Brexit negotiations.Core inflation was boosted by higher airfares, clothing and theater ticket prices. These readings, unless they are reversed next month, will bring the May 2019 MPC meeting firmly into play and will support Sterling in the short- to medium-term.
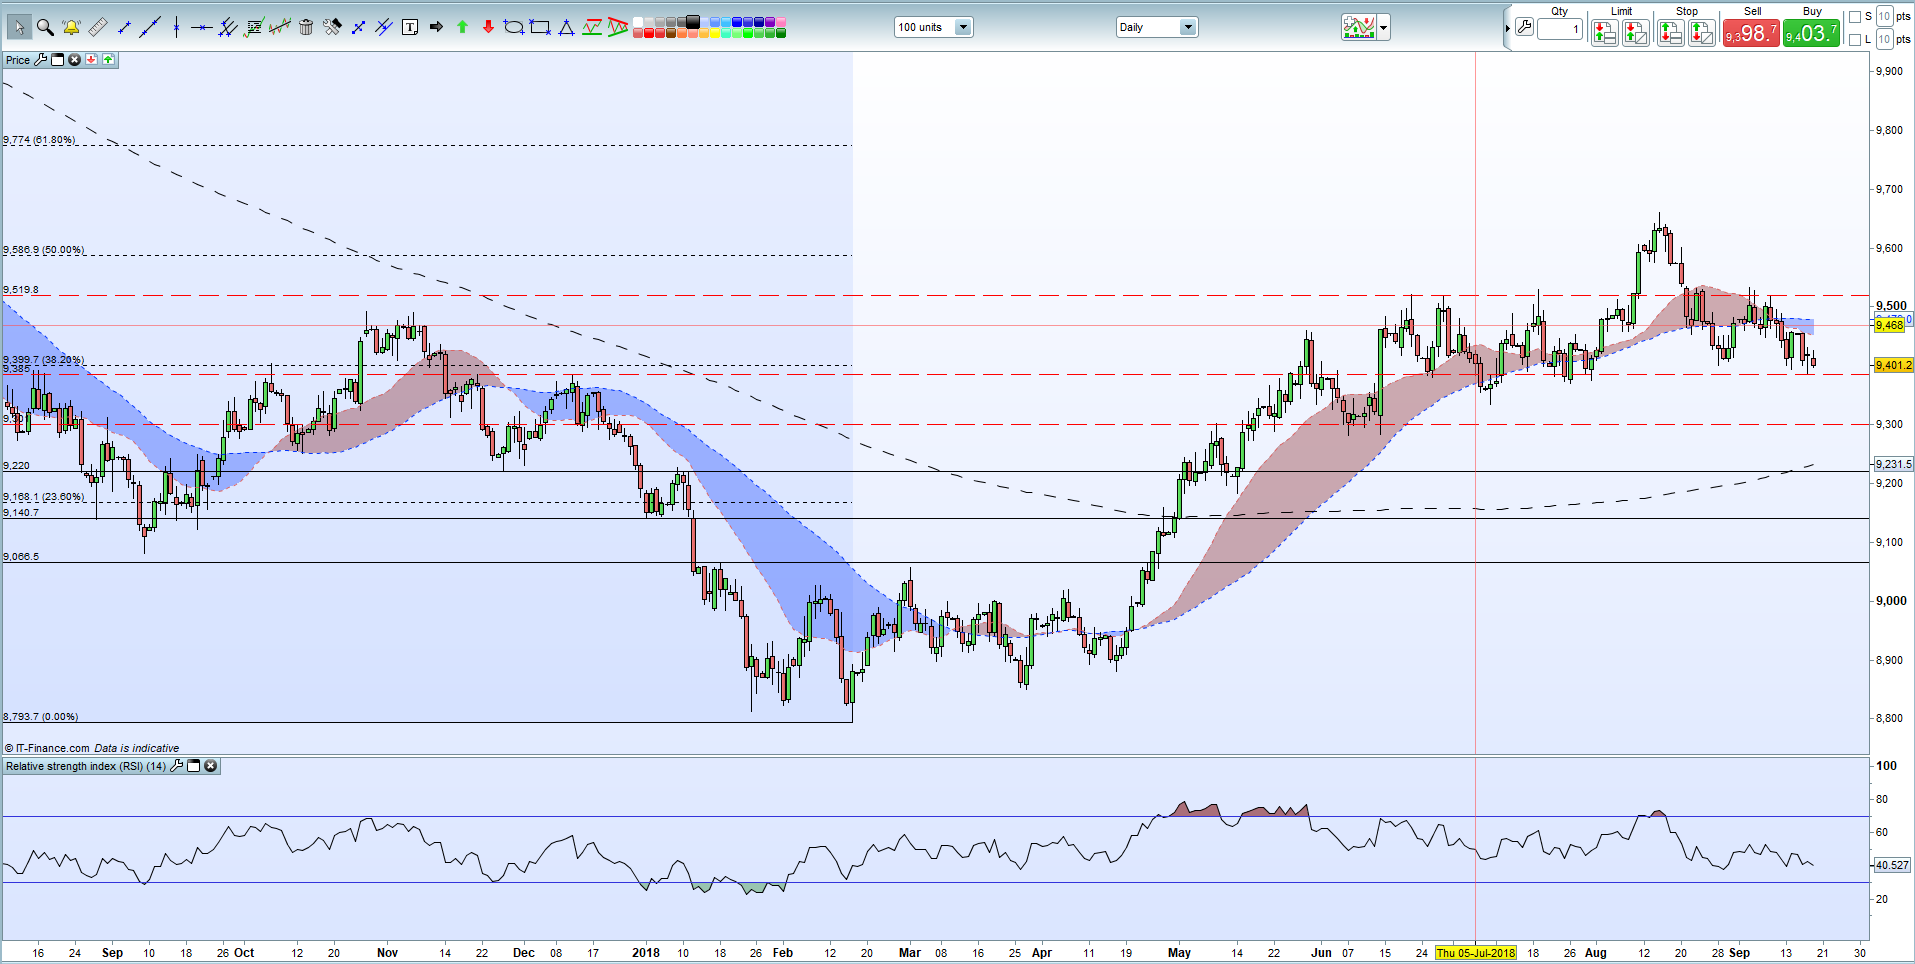
Brexit talks continue in Austria today with media reports that the EU may show some flexibility on the Irish border situation already boosting the Pound. If this is the case, and it may not be confirmed for the next few weeks, GBP will continue to price in a ‘soft’ Brexit, boosting confidence that EU-UK trade will be unaffected. Sterling has been weak/oversold in the last few months and may push back further. Against the US dollar 1.3363, the July 9 high, is the next upside target before the 200-day moving average at 1.34988.
Recent Sterling articles:
GBPUSD Weekly Technical Outlook: Trend Support Needs Respecting
GBP: Sterling Continues to Benefit From a Lack of Bad News
GBPUSD Daily Price Chart (January – September 19, 2018)

US Dollar Sitting on Important Support
The US dollar remains weak ahead of next week’s FOMC meeting and continues to test the 94.00 Fibonacci support level of the January 2017 – February 2018 down move. With a 0.25% US rate hike fully priced in for next week, and with no high importance data releases for the rest of this week, the greenback will remain vulnerable to further bouts of selling.
US Dollar Index Daily Price Chart (August 2017 – September 19, 2018)
Traders may be interested in two of our trading guides – Traits of Successful Traders and Top Trading Lessons – while technical analysts are likely to be interested in our latest Elliott Wave Guide.
--- Written by Nick Cawley, Analyst
To contact Nick, email him at nicholas.cawley@ig.com
Follow Nick on Twitter @nickcawley1


