Talking Points
- CAC 40 carves a double top pattern
- Elliott Wave pattern could not push beyond the mid-line of the Elliott Wave channel
- Bears are activated on a move below channel support near 5200
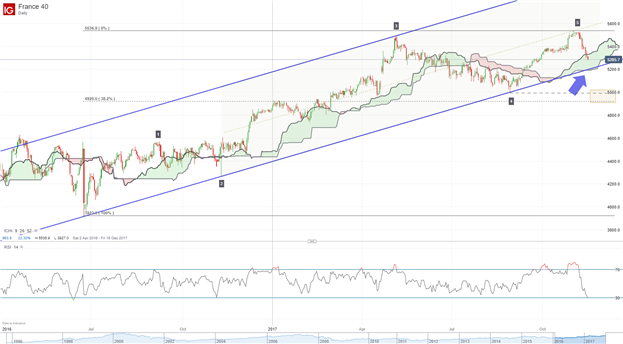
The Elliott Wave pattern on CAC 40 is intriguing. CAC 40 appears to have finished the five wave impulse move at the Elliott Wave channel mid-line. This implies a weak market and is a bearish pattern.
This pattern suggests that a longer term correction is underway. The first battle of support emerges near 5,200 where the blue Elliott Wave support channel emerges as well as the bottom of the Ichimoku cloud.
Interested in learning more about Elliott Wave and Ichimoku? Grab the beginner and advanced Elliott Wave guide as well as the Ichimoku guide.
CAC 40 Elliott Wave and Ichimoku Pattern

Created using IG Charts
Any near term bulls would need to show themselves in CAC 40 near 5,200. If this level breaks, then the door is opened up to 4,900-5,000. We have two different levels appearing there.
First, the previous wave ‘iv’ extreme is near 5,000. Previous fourth waves tend to act like a magnet in corrective moves.
Secondly, the 38% retracement of the June 2016 (Brexit) low to the November 1, 2017 highs appears near 4,921.
Therefore, if 5,200 breaks, traders can look for further weakness down towards the 4,900-5,000 price zone.
Lower potential exists, but we will need to see the structure of how the correction develops to weigh the odds further.
Why do traders lose money? Find out in our Traits of Successful Traders Research.
---Written by Jeremy Wagner, CEWA-M
Jeremy is a Certified Elliott Wave analyst with a Master’s designation. This report is intended to help break down the patterns according to Elliott Wave theory.
Discuss this market with Jeremy in Monday’s US Opening Bell webinar.
Follow on twitter @JWagnerFXTrader .
Join Jeremy’s distribution list.
Other Elliott Wave forecasts by Jeremy:
GBP/USD Hanging Over the Edge of a Cliff
AUDUSD technical forecast hints at the market searching for a bottom.
Short term EURUSD Pattern Hints at Bounce to 1.17.
USD/CAD dives 200 pips, will it continue?
Gold price forecast points towards lower levels.
Crude oil prices reach highest level since July 2015.


