


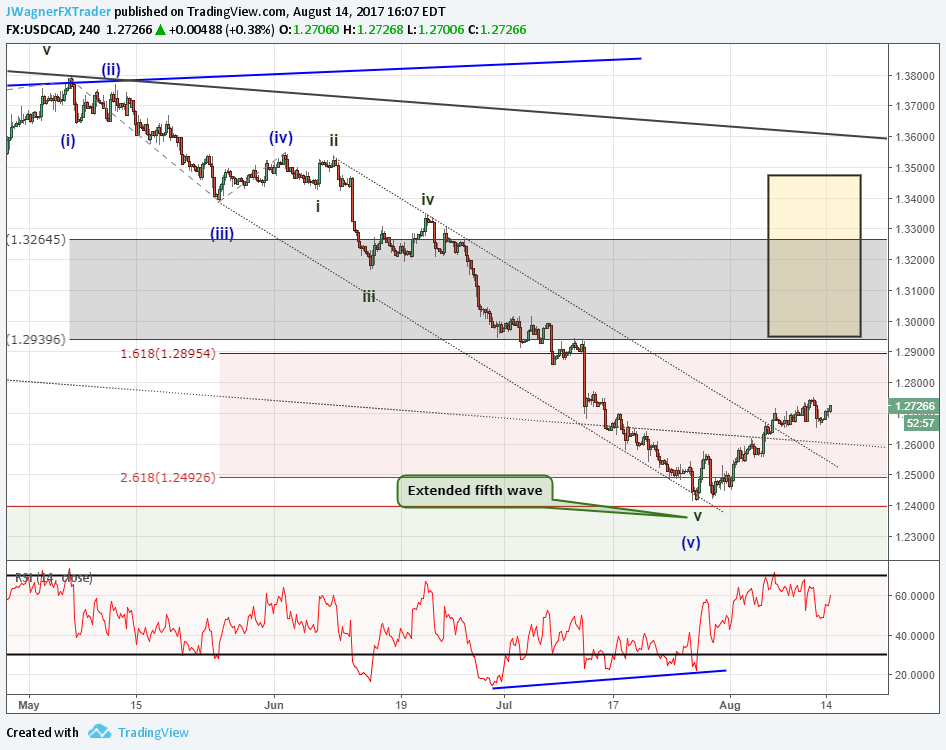
USD/CAD has quietly rallied 300 pips since forming a medium term low at 1.2413 on July 26. The next day we wrote how “a counter trend bounce may be in the early stages higher…the depth and shape of the bounce will alert us if the [previous] downtrend is over or if it is merely taking a breather. It would be considered normal for the bounce higher to work back towards the 1.28 handle.”
The current bounce higher has worked up to 1.2746. We do not have enough evidence to say for sure at this time if the downtrend ended at 1.2413, but the clues are leaning towards still higher prices.
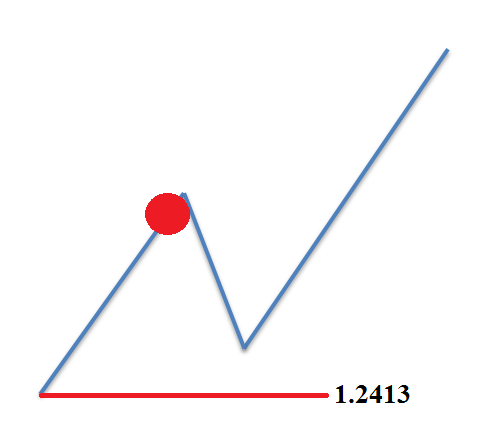
The Elliott Wave model we are following counts an impulsive wave in the works off the low. This is a key pattern. As I have mentioned many times before, there are two Elliott Wave patterns that begin with an impulse wave and both of them are followed with at least another wave of similar size. This narrows our field of vision to anticipate yet higher prices after a partial retracement lower.
Therefore, once this current impulse wave higher exhausts, we will anticipate a partial retracement lower to above 1.2413. We will use Fibonacci retracement levels and corrective wave estimates like equal wave patterns to estimate entry points. This price forecast remains valid so long as we are above 1.2413.
We are beginning to see patterns of US Dollar strength emerge. USDCAD is one of those markets where we are anticipating more USD strength. We also recently wrote about the patterns in USD/CHF and USD/NOK as US Dollar strong moves.
Why do a majority of traders lose? Find out in our traits of successful traders research.
---Written by Jeremy Wagner, CEWA-M
Jeremy is a Certified Elliott Wave analyst with a Master’s designation. This report is intended to help break down the patterns according to Elliott Wave theory.
Want to learn more about Elliott Wave analysis? Grab the Beginner and Advanced Elliott Wave guides and keep them near your computer.
Discuss this market with Jeremy in Monday’s US Opening Bell webinar.
Follow on twitter @JWagnerFXTrader .
Join Jeremy’s distribution list.
Recent Elliott Wave article by Jeremy:
EURUSD finds support at the former resistance level.
Dow Jones Industrial Average drops for 2 days in a row. What is next?
Crude oil prices stuck in a sideways triangle consolidation.


