


Crude oil prices have been range bound for the past year between $39 and $55. The model we are following suggests continued consolidation between these two price points over the coming months.
The Elliott Wave model we are following points towards a developing triangle formation for the past year. According to this model, prices are nearing the end of the fourth leg of the triangle (the ‘d’ leg). According to Elliott Wave theory, that would suggest another dip down the road that becomes a partial retracement of this June 2017 up trend. That final dip becomes the ‘e’ leg or the terminal wave of the triangle.
(Learn more on triangle patterns by viewing this hour-long webinar recording on how to identify and trade triangles...registration required.)
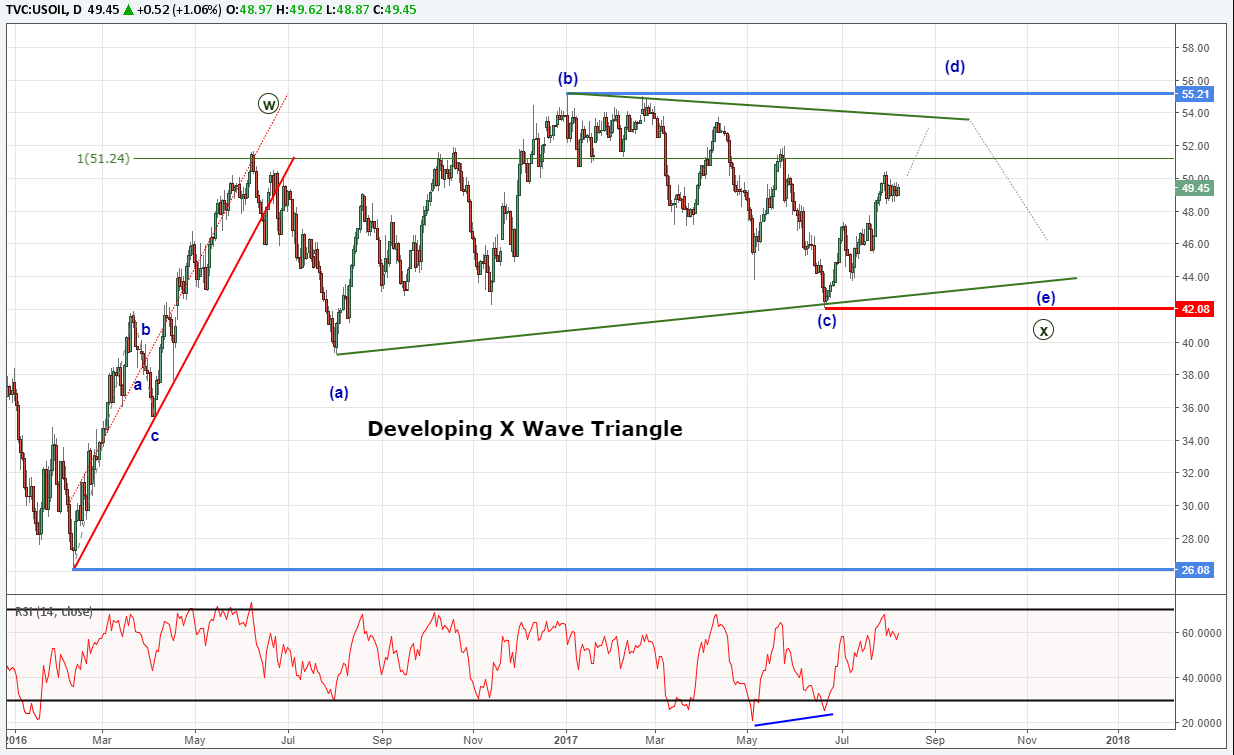
This triangle pattern is valid so long as this current rise is contained under the 2017 high of $55.21 while holding above the June 2017 low of $42.08. Therefore, we are anticipating a dip to begin from slightly higher prices. This dip could work itself back towards the mid 40’s.
This triangle pattern as labeled is a bullish triangle. Once the triangle pattern exhausts, we are anticipating a bullish breakout to above $55.21. Therefore, since the consolidation appears to be a pause of the previous uptrend, trend traders may want to follow a buy the dip strategy.
Bottom line, look for the current rise in prices to give way to a partial retracement lower that digs towards the mid 40’s. A break below $42.08 will cause the current wave labeling to be invalid and we will reconsider the wave picture at that time. If the current labeling is correct, we are anticipating an eventual break above $55.21 that begins from the mid 40’s.
Struggling with your trading? You could be making this common trading mistake.
---Written by Jeremy Wagner, CEWA-M
Discuss this market with Jeremy in Monday’s US Opening Bell webinar.
Follow on twitter @JWagnerFXTrader .
Join Jeremy’s distribution list.


