


EUR/USD broke to new 2 year highs at 1.17 two weeks ago. A common technical pattern is for price to double back to retest the point of breakout. EURUSD tested 1.17 yesterday.
EUR/USD traders continue to be bearish the pair since April 18. Though the level of bearishness has ebbed at times, 70% of traders continue to be net bearish EURUSD. Used as a contrarian sign, this is a bullish signal. Check out the live trader sentiment reading.
The pricing model we are following does show the technical pattern is incomplete to the upside. Though prices are stretched and due for a correction, we are anticipating the correction to be temporary and relatively shallow.
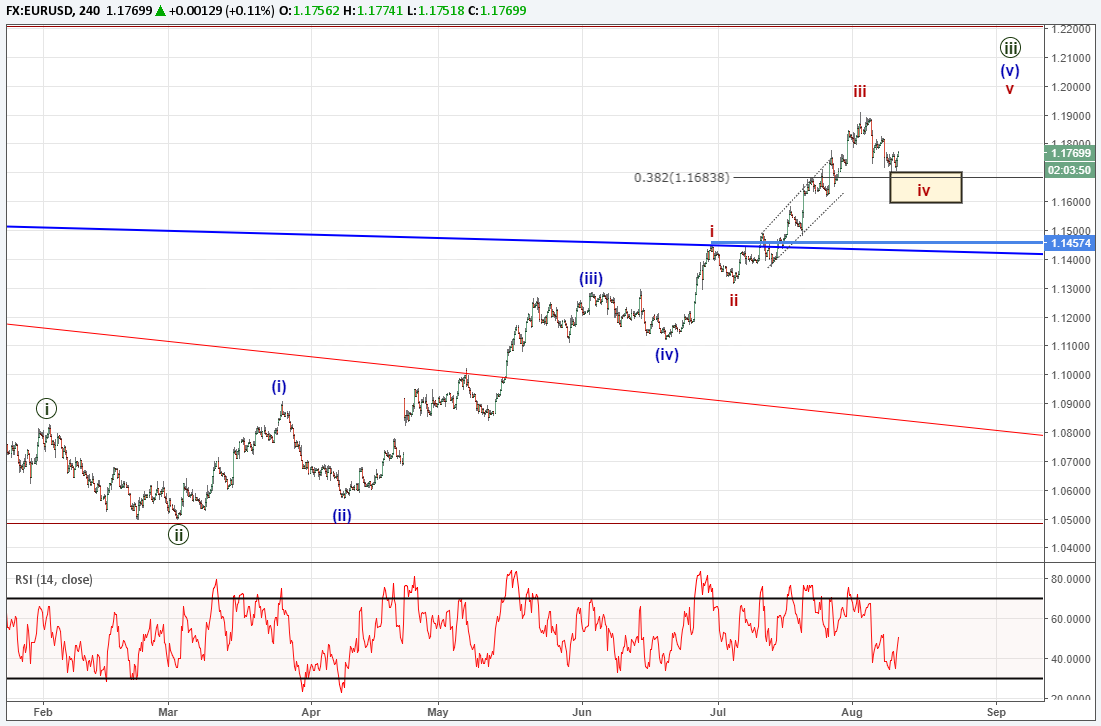
According to Elliott Wave theory, it appears we are nearing the end of the third wave (green iii wave on the chart). Third waves of an impulse tend to be the longest and strongest and this third wave started in March and traveled nearly 1400 pips. (For further study on Elliott Wave impulse patterns, watch this webinar recording.)
From a shorter term perspective, if the wave labeling is correct, then we anticipate a shallow correction to the 1.16 handle followed by another retest of the 1.19 high to finish off the third wave.
With the EUR/USD trend planted to the upside coupled with a bullish sentiment signal and incomplete bullish pattern, we will look for dips to buy. A price zone of measured support is near 1.1680. So long as prices are above 1.1457, we will maintain a bullish outlook in anticipation of the Elliott Wave sequence to complete.
Unsure of the longer term direction of EUR and USD? Grab these quarterly forecasts.
Are you new to trading the FX market? This guide was created just for you.
---Written by Jeremy Wagner, CEWA-M
Discuss this market with Jeremy in Monday’s US Opening Bell webinar.
Follow on twitter @JWagnerFXTrader .
Join Jeremy’s distribution list.
Recent Elliott Wave article by Jeremy:
Dow Jones Industrial Average drops for 2 days in a row. What is next?
Crude oil prices stuck in a sideways triangle consolidation.


