


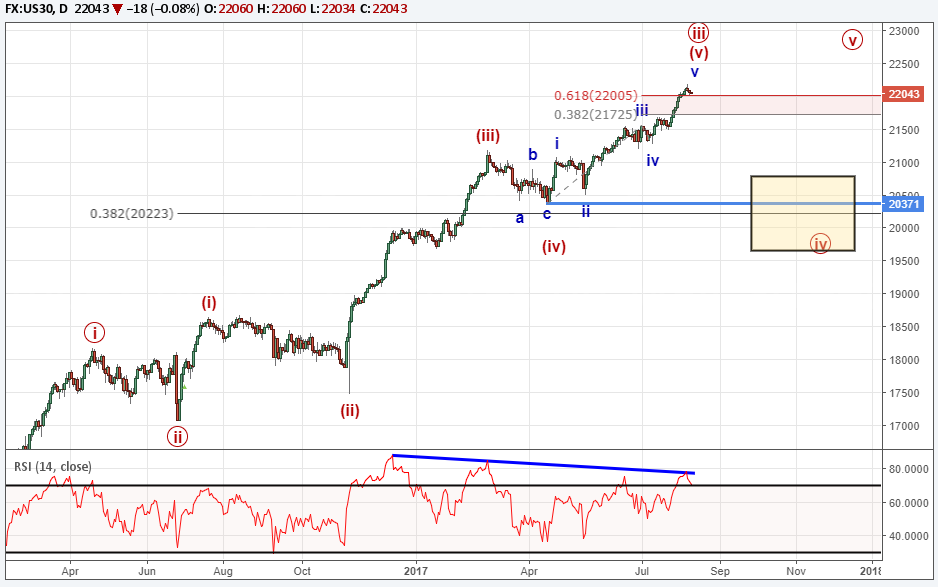
After 10 consecutive days of higher closes, Dow Jones Industrial Average hit the skids for 2 days. The Elliott Wave pattern suggests a continued correction lower towards 20,000-20,400.
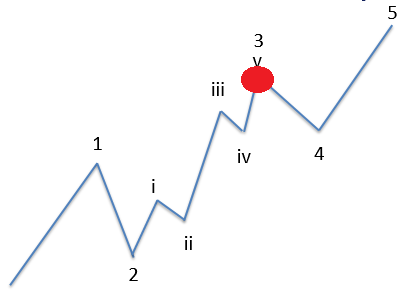
It appears DJIA may have just finished the third wave higher. In Elliott Wave terms, third waves tend to be the longest and the strongest of the five wave impulse. This suggests the meat of the move higher in DJIA may be behind us.
Why do traders lose money? Here is the biggest mistake we have researched.
One clue that hints a correction is looming is the RSI divergence. DJIA has been carving higher highs while the Relative Strength Index (RSI at the bottom of the chart) registers lower highs. This is indicative of a tiring trend and suggests the current wave is losing momentum.
If this wave count is correct, then a fourth wave correction may have begun. It is common for fourth waves to retrace 38% the length of the third wave…that calculation comes in near 20,223.
In addition, fourth waves tend to retrace back to the fourth wave of one lesser degree. In the case of DJIA, that wave is the March-April 2017 correction. Therefore, it hints that a retracement may correct back to 20,371-21,200.
Bottom line, a correction to 20,000 – 20,400 and even lower levels would be normal under the current wave pattern. Day traders may be able to find tradeable opportunities to the short side, but let us not forget the trend is still pointed higher. The better strategy would be to see how price behaves if it makes it down into the support zone.
Interested in learning to trade with Elliott Wave? Get started with the beginner and advanced Elliott Wave guide.
---Written by Jeremy Wagner, CEWA-M
If you are interested in more in depth study of impulse patterns which DJIA is in, watch this one-hour long webinar recording specifically on impulse patterns (registration required).
Discuss this market and others with an eye towards Elliott wave in Jeremy’s US Opening Bell webinar on Mondays.
Follow on twitter @JWagnerFXTrader .
Join Jeremy’s distribution list.
Other Elliott Wave articles:
Crude oil prices stuck in a sideways triangle consolidation.


