


US Dollar Technical Forecast: Bullish
- The US Dollar is coming off of a dizzying week after a bullish push was rebuffed following another strong inflation print. The net was a spinning top for USD price action last week, coming on the heels of extended wicks on either side of the matter over the past two weeks.
- There’s no signs yet of the Fed slowing down but the USD’s inability to push up to a fresh high has many asking if it’s topped or whether we’re near a pivot.
- The USD is both one of the highest yielding currencies and the global safe-haven which keeps fundamental drive behind the bullish trend. The big question at this point for near-term strategy is one of timing.
- The analysis contained in article relies on price action and chart formations. To learn more about price action or chart patterns, check out our DailyFX Education section.

It was a much more eventful week for the US Dollar than it appears from the weekly bar. Last week printed as a spinning top but as price action played out, there was quite a bit of tension on both sides.
The Greenback came into the week holding on to the bounce that started the week before. That bounce began after a support test at the 110.25 level which was a key spot on the chart given that it had previously helped to set resistance. The bullish run continued all the way into Thursday morning with the release of another CPI report that showed inflation in the US remained well-above the Fed’s 2% target. Perhaps disconcertingly, core CPI, a measure of inflation that strips out food and energy hit a fresh high at 6.6%, which eclipsed the reading from March of 6.5%. After a few months of lower core CPI following that prior high in March, hope was building that inflation was slowing, and this really seemed to feed from the same ‘transitory’ narrative that was trotted out by the Fed last year.
Core CPI Since Jan 2020

Chart prepared by James Stanley
But, yesterday proved, once again, that there’s not much that’s transitory about inflation in the United States. The initial move was brutal in equities as both the Nasdaq and S&P 500 pushed down to fresh two and one year lows, respectively. The US Dollar spiked to go along with that move, continuing the recent correlation we’ve seen where USD-strength has had a similar drive as equity weakness. But, about an hour after the data was released, all of the sudden, prices began to reverse.
By the end of the Thursday session there were already questions as to whether stocks had bottomed and the US Dollar had topped; even if it was just one day of price action. ‘It was a very strong day,’ they said but, alas, it was just one day.
This highlights the bigger-picture tension that remains in the matter of USD price action. The Dollar jumped in early-October trade as the British Pound, a large constituent of the DXY index, melted down in a collapse-like move. That spike-down in Cable led to a spike-up in USD, and as GBP/USD pared those losses the Dollar pulled back, exposing a long upper-wick on the top of a weekly candle in early-October.
From a technical perspective, in a bullish trend that’s overbought from a number of vantage points, an extended upper wick of that nature will often be approached for a reversal. But, given the panic-prone situation in the UK and how that pullback seemed to be more of a temporary item than a full-fledged reversal, I retained a bullish bias on the USD. I had addressed this in a US Dollar Price Action Setups article in early-October, highlighting monthly and weekly charts of DXY along with focus on some key areas of support.
US Dollar Monthly Chart
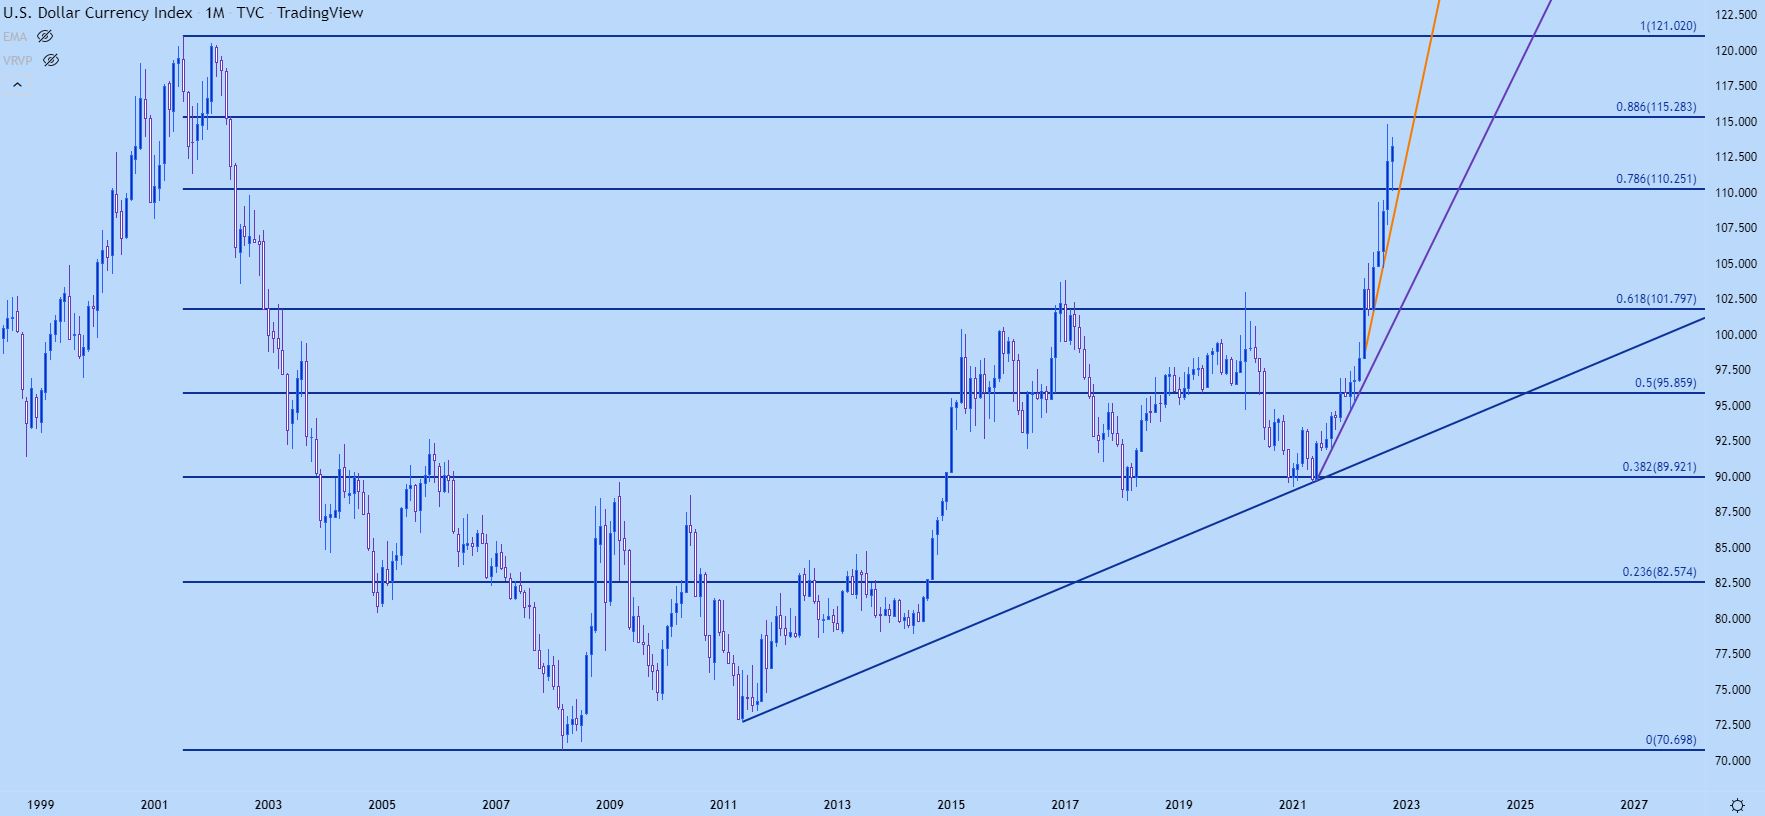
Chart prepared by James Stanley; USD, DXY on Tradingview
One of those areas came into play last week, taken from prior resistance around the 110 psychological level. A bounce from that support zone led to an ascending triangle formation which quickly led to another bullish breakout and that move extended into last week – all the way into that Thursday CPI report.
While the trend reminds decisively bullish, the challenge at this point appears to be one of timing, particularly if we take into account where the pullback after the CPI report started from. It seems that there’s been little tolerance for the USD above 113.80 at this point and perhaps that changes; but we also have to consider the role of counterparts and the fact that for that move to happen – we’re likely going to need a bearish break in either EUR/USD or GBP/USD. And along the way, we’d probably need to avoid another intervention run from the BoJ/Ministry of Finance in Japan as JPY makes up a large portion of DXY, as well, and the pair has been pushing 24-year highs last week which has helped to keep DXY as relatively strong.
I’m keeping the forecast at bullish given the veracity of the trend, highlighted on the below chart.
US Dollar Weekly Chart

Chart prepared by James Stanley; USD, DXY on Tradingview
US Dollar Levels
For next week there’s a few different areas of support that remain attractive for longer-term trends. The first and nearby was resistance in the ascending triangle from earlier in October, and that runs from around 111.74. Below that, the same zone that produced the bounce move comes into the picture and I’m tracking that from 110 up to 110.25. And below that, there’s even some reference for another prior spot of support from prior resistance, taken from around 109.14-109.27. This would also be getting closer to a bullish trendline that was last in-play in early-August.
US Dollar Daily Chart
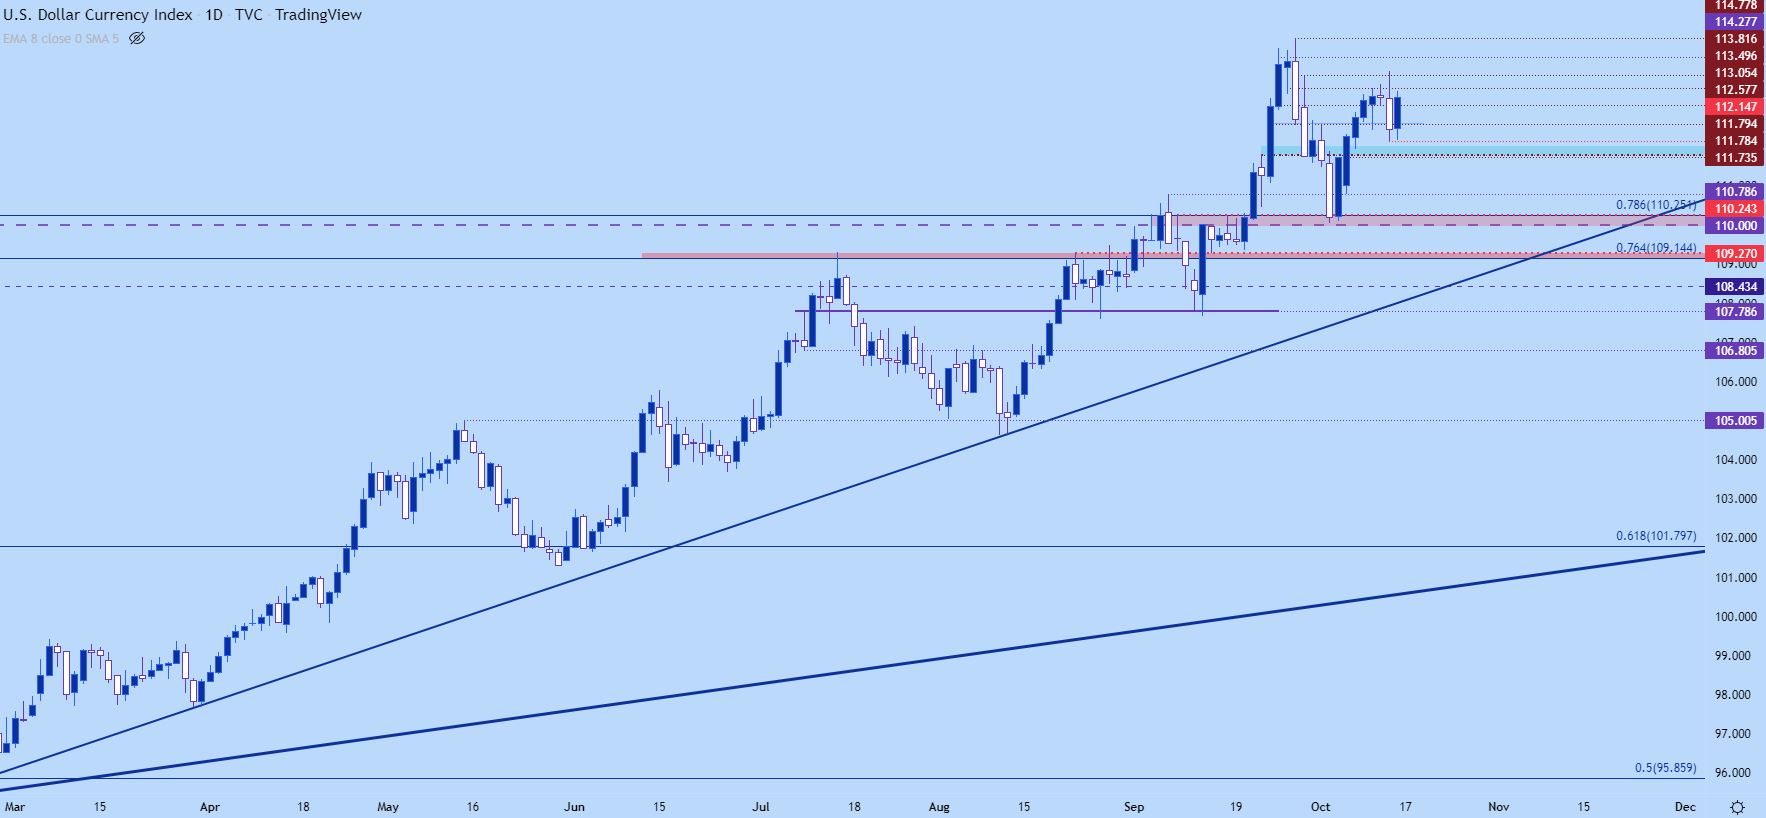
Chart prepared by James Stanley; USD, DXY on Tradingview
EUR/USD
It remains my contention that the ‘big’ move in the US Dollar is going to be fueled by the Euro. And last week provided another checkpoint along the way, as a series of hawkish comments from the ECB seemed to be ignored as EUR/USD held below the .9833 resistance level. And while the ECB can hike rates, there’s also fear around what impact that might have on an already fragile economy. And with inflation taking hold there, the ECB seems to have little choice but to hike into what seems more and more like an oncoming recession.
Another point of emphasis here that I think gets lost on many: A stronger US Dollar and a weaker Euro is, in essence, exporting US inflation to Europe. A weaker Euro means imports are more expensive and this is an inflationary factor that rate hikes not met with a stronger currency will be unable to offset.
So, if the ECB hikes and the Euro remains weak, inflation can remain as a problem, particularly with the US continuing to fervently hike rates in the effort of addressing inflation in the US. The net-effect of those rate hikes will be dulled and the European economy will face pressure from tighter monetary conditions while inflation continues to drive from exogenous factors.
The way that this script could be flipped would be a softer Fed to match that more-hawkish ECB but then, there’s the problem of US inflation and the central bank, at that point, would be prioritizing the European economy over the US and that doesn’t seem like a probable outcome at the moment.
None of this is new, however. One look at the trend on the weekly EUR/USD chart will show this well as an aggressive down-trend remains in-place, which mirrors the aggressive up-trend on the weekly US Dollar chart above.
EUR/USD Weekly Chart
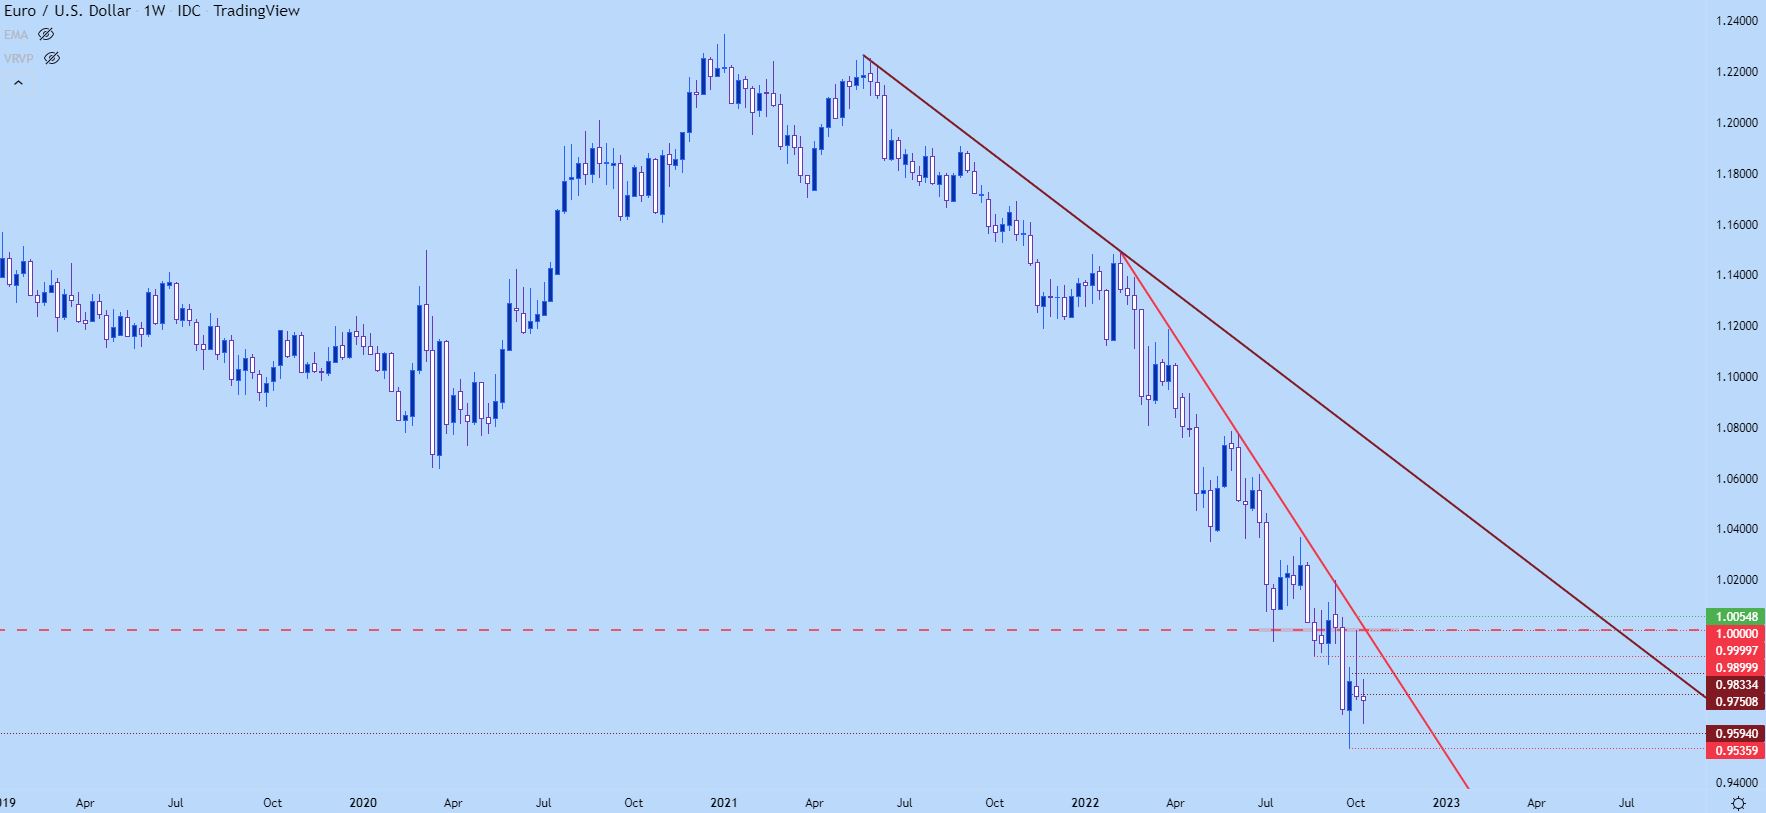
Chart prepared by James Stanley; EURUSD on Tradingview
Going down to the daily chart highlights the main issue at the moment and, again, that remains a function of timing. The parity test earlier in October brought a strong bearish response and that pushed prices all the way down to the .9700 handle. But, there was little drive below that level and there was even the counter-trend bounce on Thursday after the strong CPI report, further adding opacity around bearish trend themes in the pair.
So, at this point, bears can look to pullbacks in order to allow for longer-term positioning in the matter; or can look to breakout strategies on pushes to fresh lows. For pullback themes, there remains resistance potential around a prior support swing, taken from around the .9900 level. Above that we have the bearish trendline that projects to around .9950 for next week. And above that, parity.
If bulls can pose a breach above parity then likely something else is going on and the bearish trend will be brought into question, at least for the near-term. On the support side of the matter, I continue to track the same .9594 level that I had looked at a few weeks ago as that helped to build a morning star ahead of the late-September bounce. Below that is the current 19-year-low at .9536, after which the .9500 psychological level comes into play.

EUR/USD Daily Chart
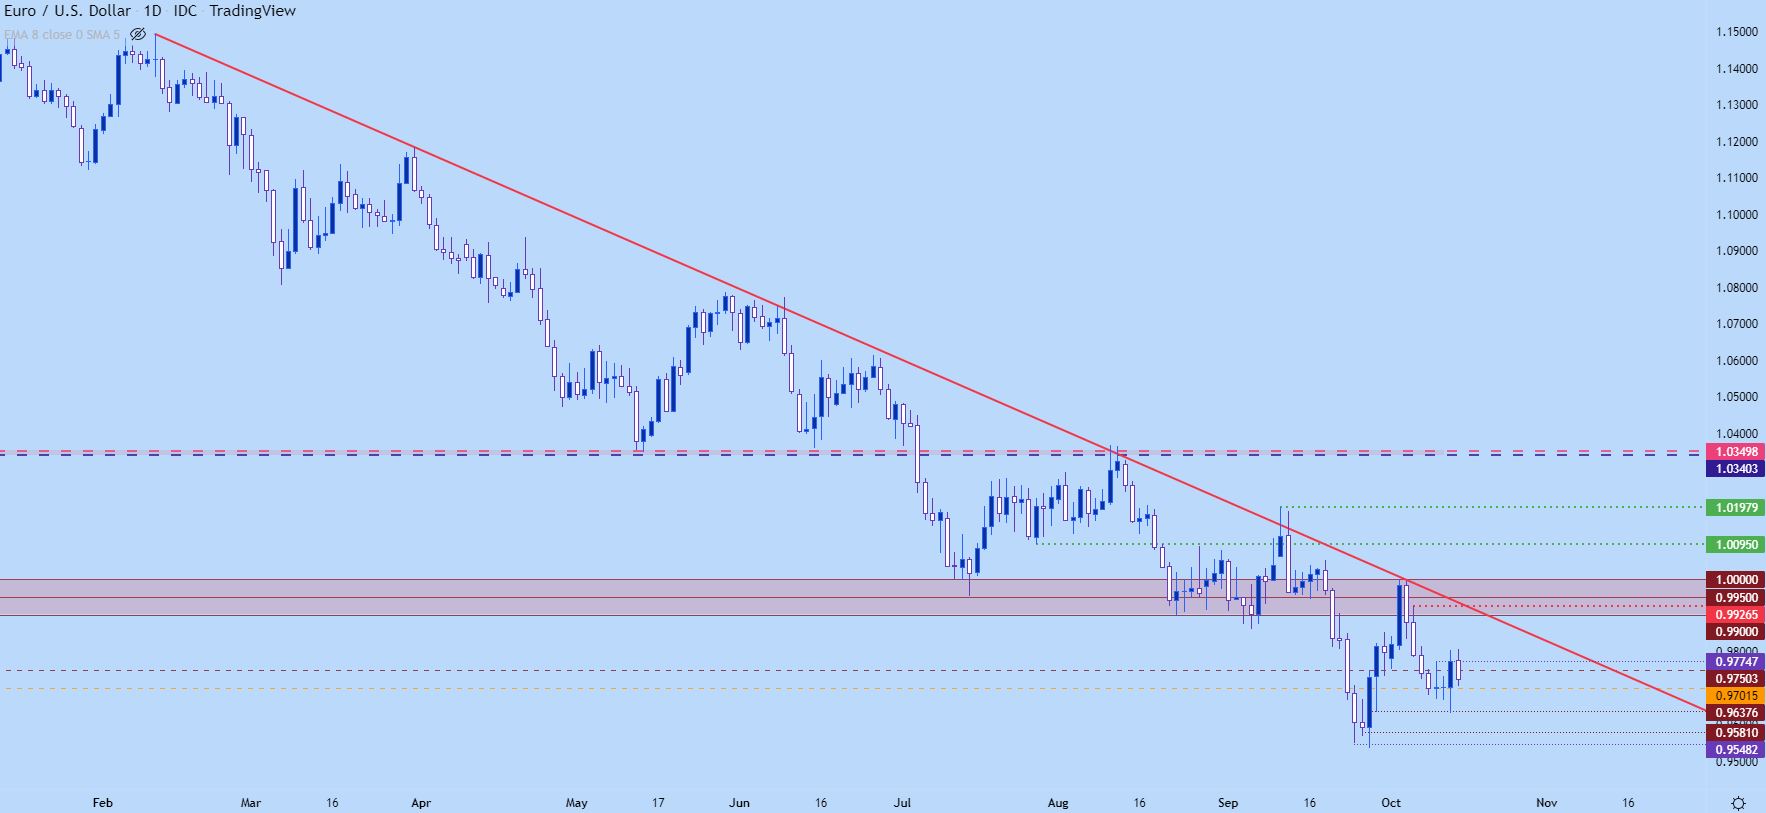
Chart prepared by James Stanley; EURUSD on Tradingview
GBP/USD
Cable continues to be mired by political headlines and this is something that obscures long-term trends. It’s difficult to imagine how any of the current commotion leads to resolution anytime soon but from price action, GBP/USD has actually traded somewhat cleanly around pre-existing levels, if with an extra dash of volatility added into the equation.
I think the weekly chart illustrates the situation quite well, which is messy to say the least.
GBP/USD Weekly Chart
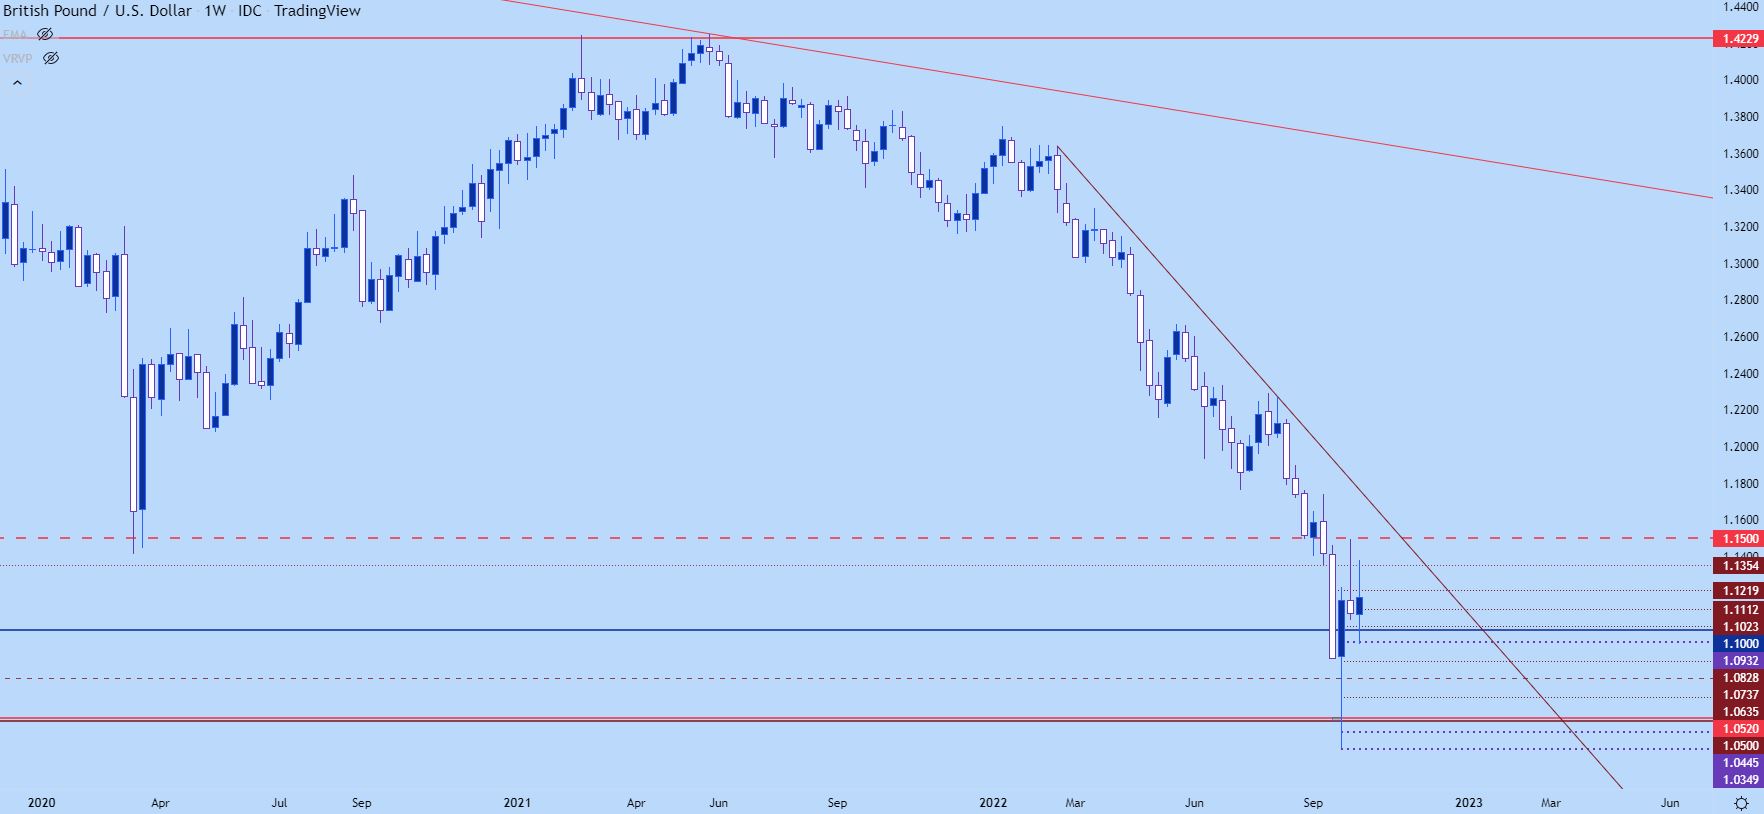
Chart prepared by James Stanley; GBPUSD on Tradingview
GBP/USD Shorter-Term
On a shorter-term basis GBP/USD has shown some attractive inflections from pre-existing levels, with much of the below chart holding throughout the past week. For longer-term trends, I would want to see either a break above 1.1500 to re-open the door for bullish scenarios and for bearish scenarios, I want to see a push back-below the 1.1000 psychological level.
GBP/USD Four-Hour Chart
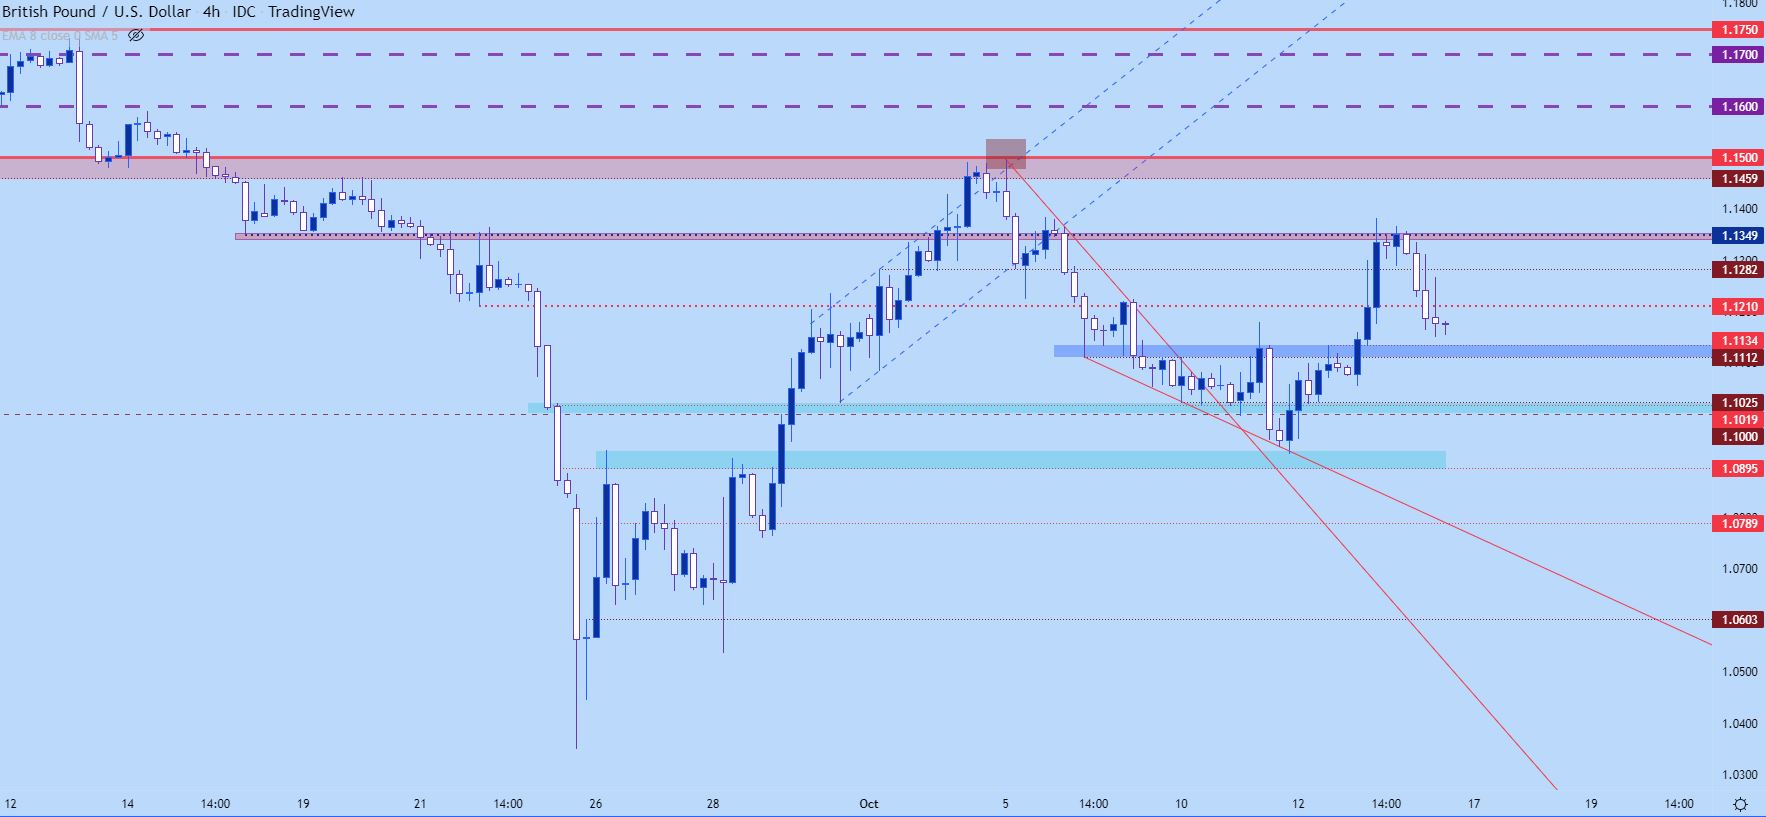
Chart prepared by James Stanley; GBPUSD on Tradingview
USD/CAD
It was a feast and then famine and then feast again type of week for USD/CAD bulls. Ahead of the CPI report the pair had built both an inverse head-and-shoulders pattern and an ascending triangle.
That broke out with aggression right after the CPI release but as matters reversed, so did USD/CAD, pulling back all the way to the 1.3700 psychological level where a build of support showed up. And then prices pushed right back above the 1.3850 level that had previously set resistance.
USD/CAD Four-Hour Chart
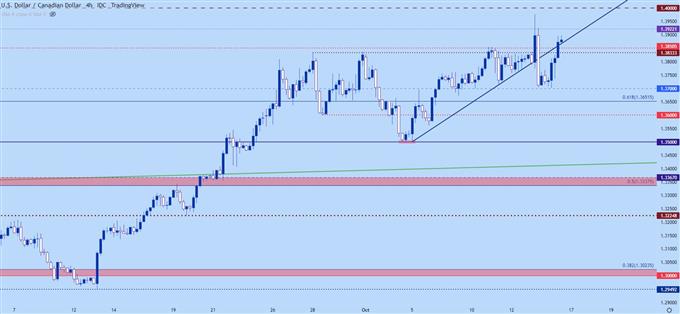
Chart prepared by James Stanley; USDCAD on Tradingview
USD/CAD Longer-Term
The four-hour chart above doesn’t show much for trends although the bullish reaction to the pullback is interesting. This highlights buyers that were quick to jump on the bid as price settled around that 1.3700 handle but, nonetheless, it doesn’t make the chart much more clear for near-term trends.
Going out to the weekly can help with that though, as it highlights a bigger theme, in my opinion, and that’s the move that’s priced-in ever since the support test at 1.3500 in the prior week. That support test, similar to the 1.3700 test, saw buyers grind before taking-control of the matter and this also highlight a point of strategy for next week: practicing patience on the pullback and letting support show its hand before looking for continuation. This highlights higher-low support potential at that 1.3850 spot that was previous resistance, if we do see an early-week build of support next week.
USD/CAD Weekly Price Chart
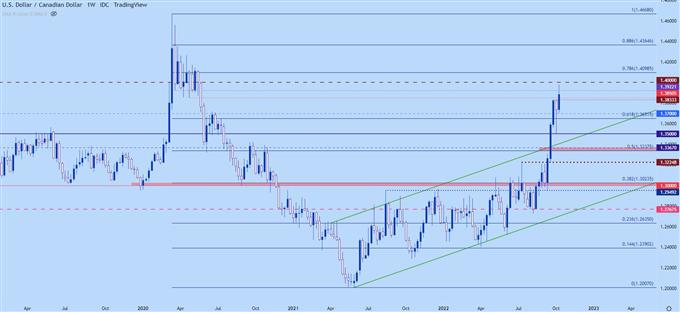
Chart prepared by James Stanley; USDCAD on Tradingview
USD/JPY
USD/JPY is trading at a fresh 24-year-high and the big question here remains around intervention potential. The BoJ intervened at request of the Ministry of Finance on September 22nd and that brought a quick rush of JPY-strength. But, as I highlighted shortly after the positive carry on the pair was still encouraging bullish behavior and within a day price was already back around the theoretical line-in-the-sand of 145.00.
Since then – buyers have posed another breakout and prices in the pair have set a fresh 32-year-high, crossing the 147.65 level that was a high watermark in 1998. There was a quick pullback after the CPI release on Thursday of a little more than 120 pips in USD/JPY. There were accusations of that being BoJ-related but I was unable to find any confirmation of such and, instead, it may have just been a stop order sitting above the high watermark that got triggered on a touch, leading to a thrust of supply into the market.
Whatever it was – it wasn’t able to last for long – and even as the USD pulled back later in the Thursday session, USD/JPY remained relatively strong and eventually battered its way above resistance and to fresh highs.
The fear here is another BoJ sponsored stop-run. It does appear that there’s a lack of continuity around the matter from Japanese policymakers. Kuroda said at the last BoJ rate decision that he didn’t foresee any changes to guidance for ‘two to three years.’ USD/JPY pushed above 145.00 and then the Ministry of Finance ordered the intervention shortly after. More recently, Kuroda has opined that Yen-weakness isn’t a terrible thing for the Japanese economy and that’s been read as more fuel for the bullish USD/JPY trend.
So, the fear is another one of those interventions, out of the blue, that can entail a multi-hundred pip pullback which can gap-through stop orders.
Just as I said the morning after the intervention, I will say again, USD/JPY is much more attractive from support when that positive carry can drive in more demand. And an intervention-fueled pullback could produce that support inflection.
USD/JPY Daily Chart
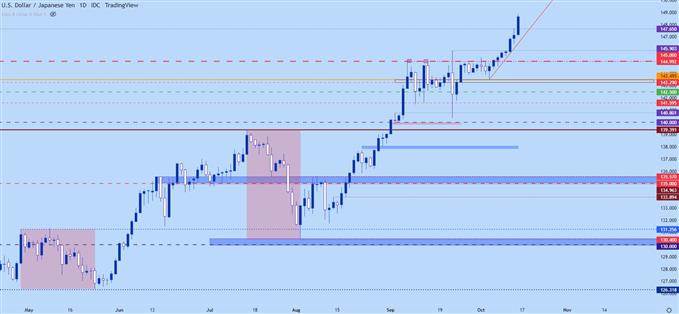
Chart prepared by James Stanley; USDJPY on Tradingview
--- Written by James Stanley, Senior Strategist, DailyFX.com & Head of DailyFX Education
Contact and follow James on Twitter: @JStanleyFX


