


Indices Talking Points:
- Stocks sold-off ahead of the US open this morning following another above-expectation CPI report.
- The analysis contained in article relies on price action and chart formations. To learn more about price action or chart patterns, check out our DailyFX Education section.
- The Nasdaq hit a fresh two-year-low on this morning’s run, and the Dow sold-off from a key area of resistance that was highlighted in this week’s forecast. The S&P 500 set a fresh yearly low, making a fast run at the 3500 level which was my first support target on the index looked at in the Q4 Top Trades. To get the full Top Trades report, the link below can help:

Trends do not move in a linear fashion. Retail traders are probably pretty well-aware of that given recent volatility in markets and for those trading in equities or equity-related markets, that’s been a very obvious lesson over the past nine months.
In the 12 years after the Global Financial Collapse, the world became addicted to cheap money, brought upon by massive stimulus from global central banks. Natural resources remained cheap, helped upon by globalization that’s seemingly coming more and more unraveled as the year wears on. Cheap money drove markets higher for years and after a long enough trend, it’s almost as if central banks forgot about the possibility of inflation. And when inflation did show up, they dismissed it, all the way until it grew to intolerable levels of more than 6% annualized. That’s about the time that they started to change course but that took another four months, with the first rate hike in March after Powell had ‘retired’ the word ‘transitory.’
And old habits die hard. Even with a pretty clear message from the Fed that inflation is the priority, markets continue to look for a glimmer of hope that they might go back to their old ways. It’s almost ironic, because that very same hope and enthusiasm and bullish behavior is what the Fed seems to want to price-out of markets (in order to get inflation back to target).
We got the most recent installment of this story this morning and Core CPI set a fresh high at 6.6%, eclipsing the prior high of 6.5% that was released in March. After that prior spike, Core CPI went lower – 6.2% in April and 5.9% in June. Hope built that inflation had peaked. Another 5.9% print showed in July but in August (which was released in September) – Core CPI had shot back-up, printing at 6.3%.
This morning it showed at 6.6% to create another fresh high and to firmly dash the hopes that inflation had topped. The immediate reaction was brutal with a support break in US equities, key of which was a fresh yearly low in the S&P 500 and a fresh two-year-low in the Nasdaq.
Core CPI: March Wasn’t a Peak
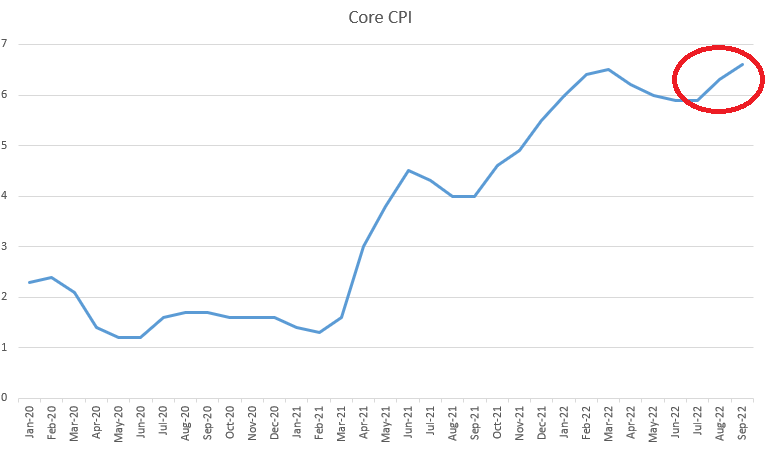
Chart prepared by James Stanley
I had looked at this in this week’s technical forecast for equities, keeping the forecast for this week as bearish. Below, I look into each of the three major US equity indices.
S&P 500
Until this morning’s CPI print, S&P 500 futures had not yet tested below last week’s low. And last week’s price action produced an inverted hammer formation on the weekly chart which kept the door open for a bounce until the low was invalidated this morning. But, as I wrote in the forecast, it’s the bigger-picture trend that remains attractive on the bearish side of the matter and given the fundamental drive, there was little reason to look for a bigger-picture reversal.
But, that being said, the first line of this article comes into the picture: trends do not move in straight lines. The backdrop here has been bearish for some time but, to date, there still seems to be some ‘buy the dip’ mentality going on here, predicated on the hope that the Fed may shift their stance towards fighting inflation. This would be similar to albeit lesser than the theme that showed up in mid-June, just after the Fed’s first 75bp rate hike, after which stocks would rally for the next two months.
That was stepped on in August and then pounced on later in the month by Chair Powell at Jackson Hole with his shorter, more succinct message that the Fed was not done with rate hikes. But, even then, once price pushed down to fresh lows sellers slowed the approach and there’s been a lack of continuation on bearish breakouts. That June swing low was even in-play this morning, just ahead of the CPI report, a level at 3659.
And even right now – we’re seeing some of that buy the dip behavior after a print to fresh lows, just above the 3500 psychological level that I’ll look into in greater depth below.
S&P 500 Daily Chart
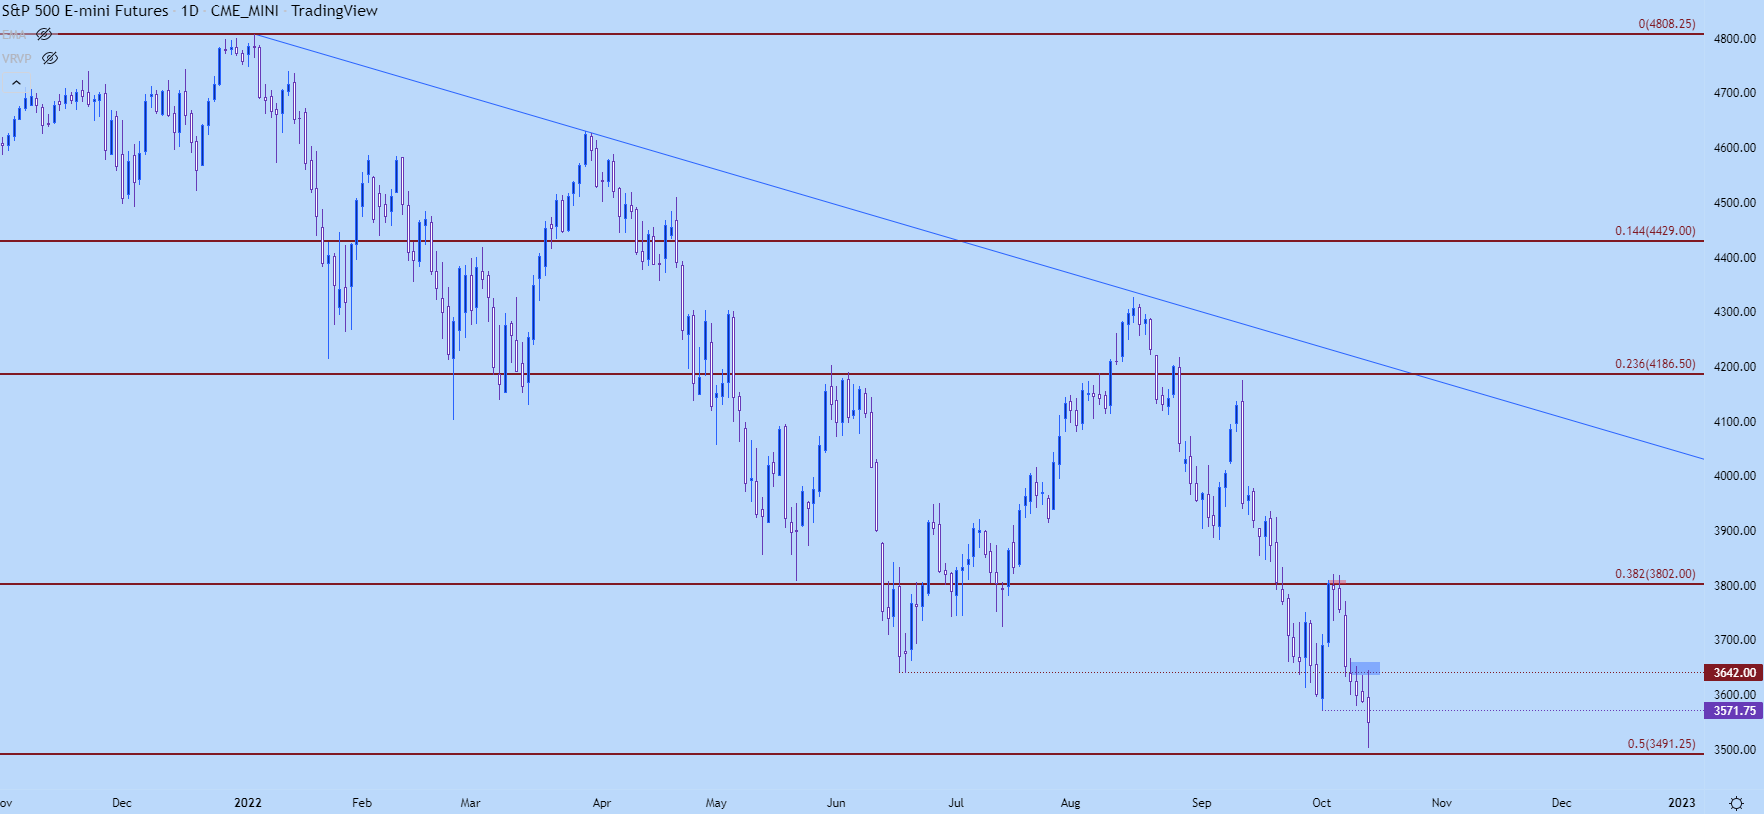
Chart prepared by James Stanley; S&P 500 on Tradingview
S&P 500 Longer-Term
That 3659 level? Yeah that’s the 38.2% retracement of a key Fibonacci retracement, taken from the 2016 low up to the January high. That helped to stem the declines in June – even after the Fed hiked by 75 bps and warned that more were on the way. It’s been a slow grind below that level for bears ever since we did see a support break and we’re fast nearing the next level down on the chart.
Now, regarding near-term and this is something I discussed at-length in this week’s equity forecast: I do not think we have seen broad-scale capitulation yet. Normally, in a falling market, there’s also a pullback in yields as investors prepare for rougher roads ahead. That makes bonds as an attractive alternative because not only can investors lock-in higher rates before yields fall further, but falling yields can also make the principal value of those bonds higher. So, bonds can actually be treated similar to a stock – traded for principal gain if there is, in fact, falling yields.
We don’t have that here. Both stock and bond prices are falling and there’s nowhere to hide. So, I think for many long-term equity investors, they’ve simply rode the wave, for now. Short-term sentiment, however, has been and continues to get heavily bearish, which can be witnessed in put-call ratios. And sentiment matters – that can slow declines as a heavily-short market leaves few investors on the sidelines willing, able and ready to sell, particularly if we’re not seeing that long-term capitulation factor come into play.
This morning may serve as an excellent example of that – where a negative market item produces a fast and heavy breakout, which is then faded after-the-fact as short-term bears cover positions.
Does this mean that the sell-off is over or that it’s hit a brick wall of support? No, but it does mean, like any other trend, this will not be linear, even if the fundamental backdrop appears as though it should be.
From the Weekly S&P 500 chart, we can zero-in on a few other zones of note. My next support down is around 3500, which is confluent with the 3491 Fibonacci level. That’s 50% of the pandemic move, after which 3400 comes into play as that was the pre-pandemic swing-high. Below that, there’s Fibonacci reference around both 3300 and 3200, and if we do see that capitulation factor come into play, there’s even some reference down in the 2800 area on the chart. That zone is approximately 21% away from current price (as of this writing) and while it seems a far-out possibility, if the Fed’s tightening does break something and panic enters the equation, it might be closer than we’d hoped.
S&P 500 Weekly Chart
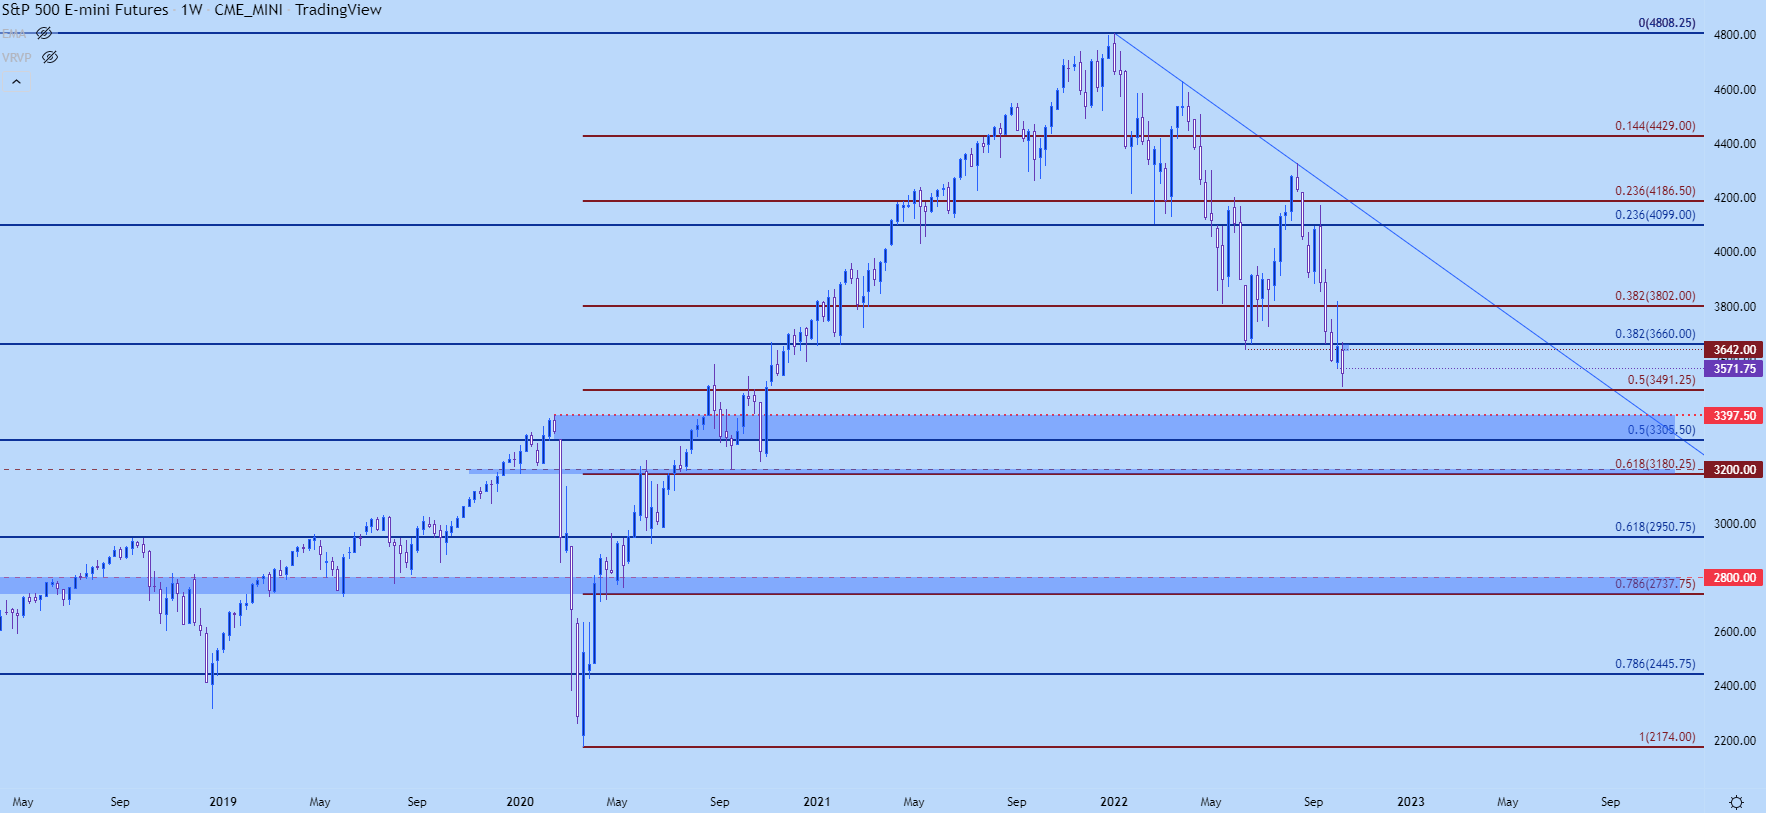
Chart prepared by James Stanley; S&P 500 on Tradingview
Nasdaq
The Nasdaq 100 has already hit my first target from this quarter’s Top Trades installment and that’s at 10,501. This is simply the 61.8% Fibonacci retracement of the pandemic move. Prior support, from around 11,091 up to 11,294 becomes resistance potential now, and a break below that 10,501 level opens the door for a continued slide down to the 10k psychological level. I have that price as confluent with the pre-pandemic swing-high at 9763.
The tech-heavy index has appeared to show greater bearish behavior over the past week, which is a change-of-pace from the prior week when the S&P appeared to lead on the way-down, which would be an abnormality for a bearish market. The fact that the Nasdaq has started to lead the S&P 500-lower highlights the growing drive from bears as that capitulation factor may be getting closer, which I would expect to begin in high-beta tech stocks.
Nasdaq 100 Weekly Price Chart
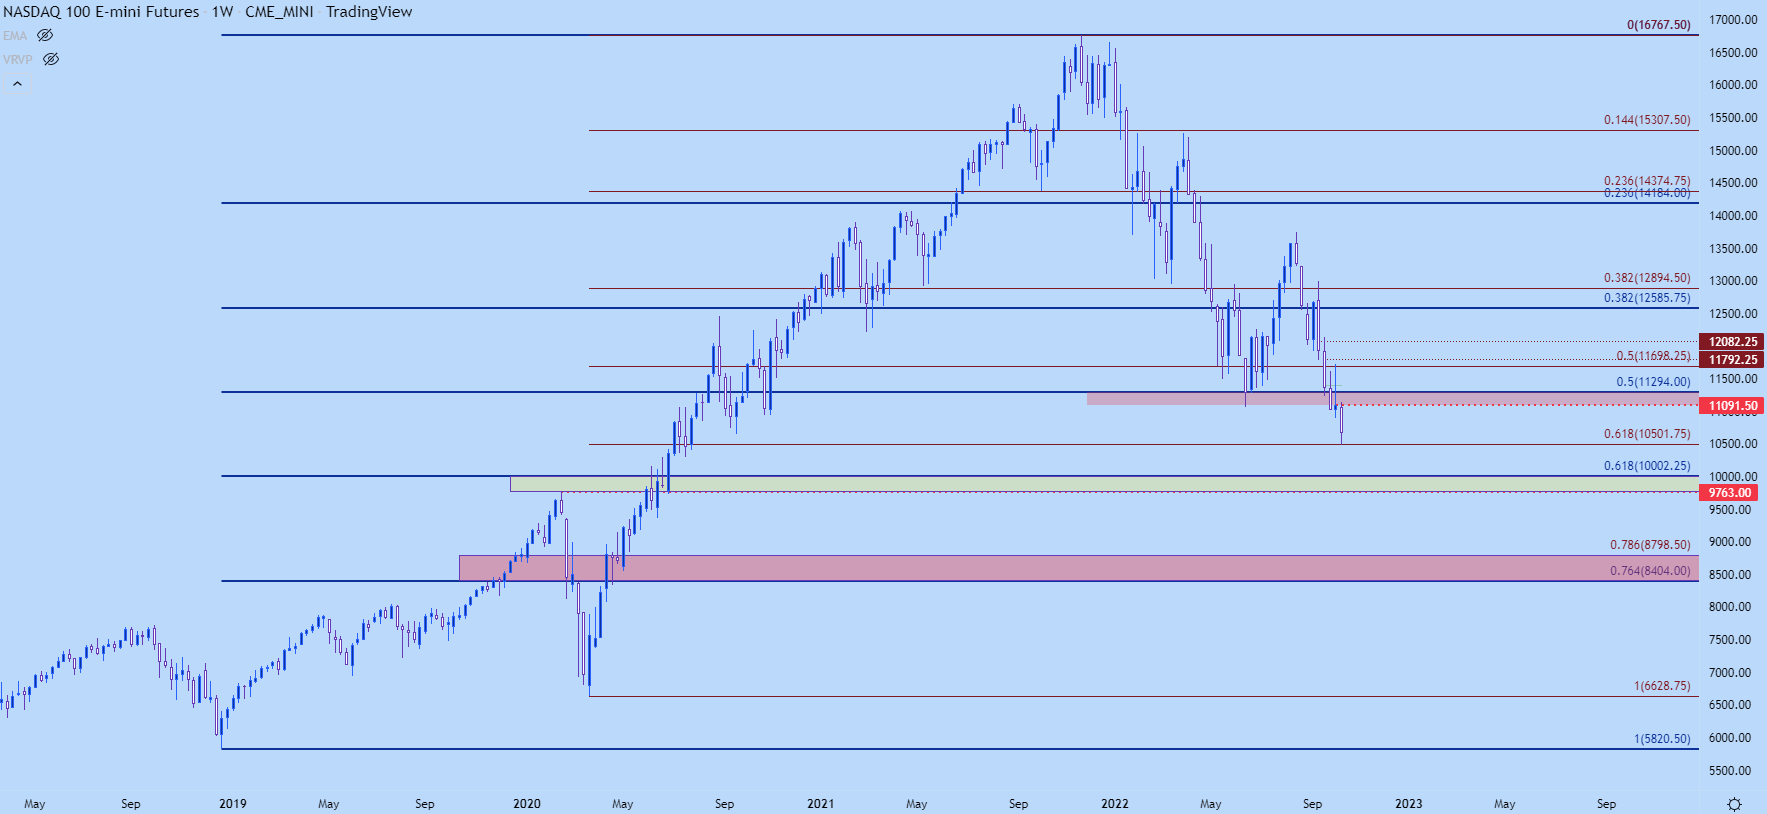
Chart prepared by James Stanley; Nasdaq 100 on Tradingview
Dow
The Dow hasn’t set a fresh low yet as price has held above last week’s swing-low. This highlights the fact that for bearish equity plays, there may be greener pastures elsewhere, in either of the two above indices. And, if looking for rebound plays, perhaps the Dow brings a bit more optimism into the mix based on the fact that bulls did defend the lows this morning whereas that didn’t happen in either of the above two markets.
There was some excitement this morning in the Dow, however, as prices put in a clean test of a confluent resistance zone before selling off. This puts a line-in-the-sand that can be looked to and I had talked about that level in this week’s equity forecast, plotted at 29,671.
Dow Jones Daily Chart
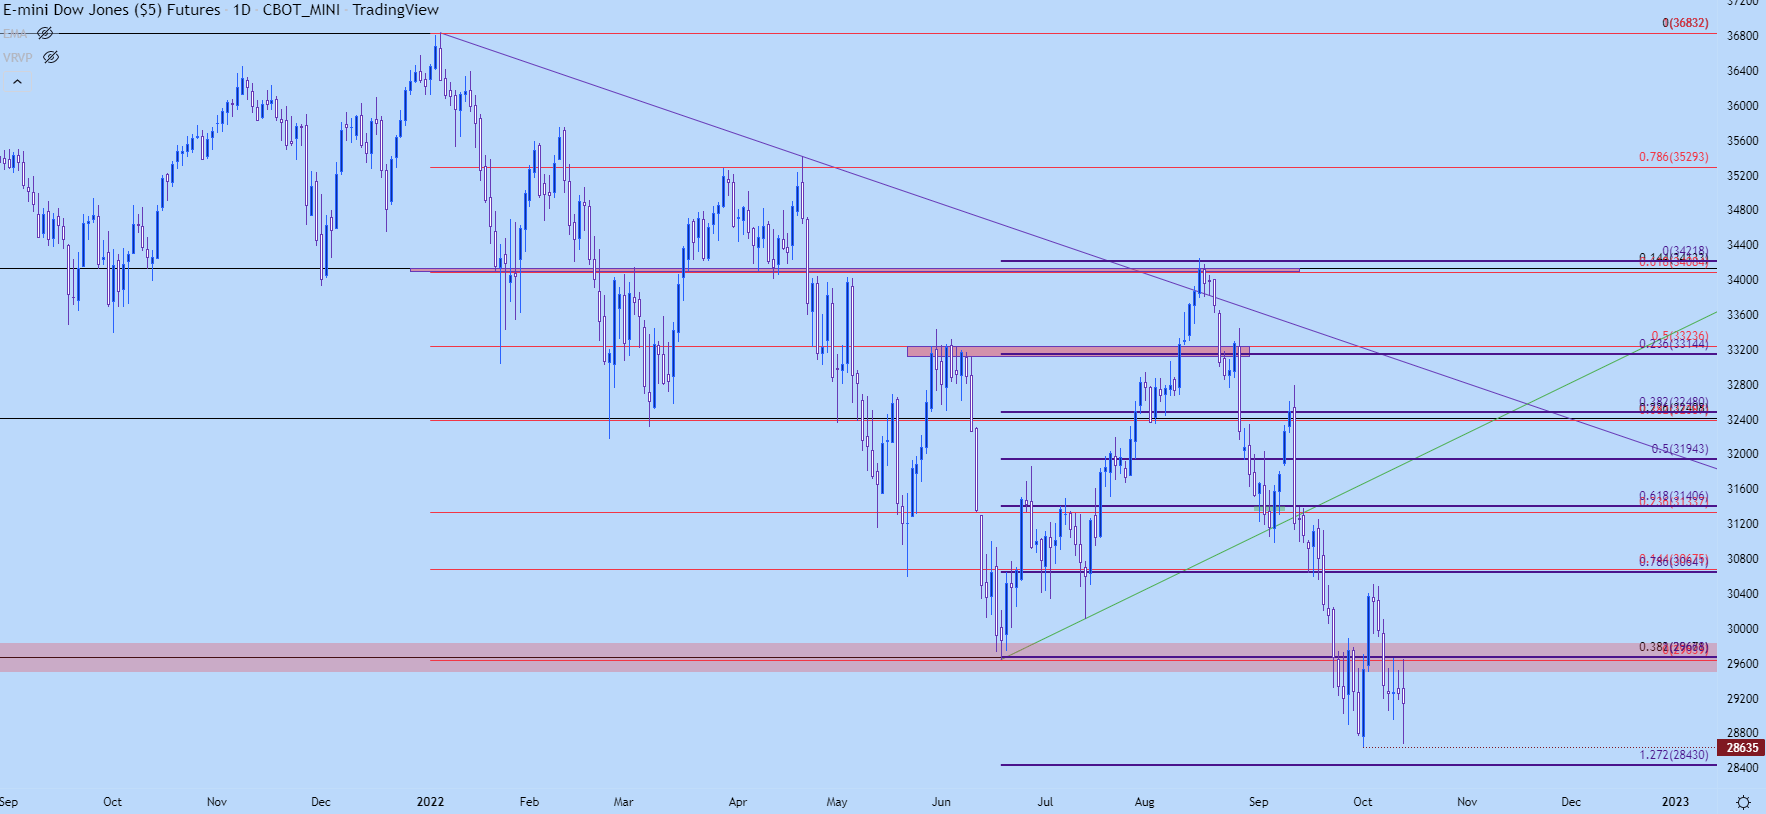
Chart prepared by James Stanley; Dow Jones on Tradingview
--- Written by James Stanley, Senior Strategist, DailyFX.com & Head of DailyFX Education
Contact and follow James on Twitter: @JStanleyFX


