


Indices Talking Points:
- Equities have started Q4 on a brighter note than they ended Q3 and this has brought on calls from some indicating that stocks have bottomed.
- Markets seem to still have the conditioning of expecting the Fed to get dovish with policy in the face of slowing economic data. And, in an environment where inflation is sub-2%, that certainly did seem to be the case. The difference this time is inflation, and the big question is whether the Fed will pivot, even though there’s been little sign of such so far.
- On that note of conditioning, Q3 opened with stocks holding on to bearish trends with support established right after the June FOMC rate decision. They then went on to rally into mid-August, finally tipping-over during Chair Powell’s speech at Jackson Hole. The Fed has been noticeably-hawkish since.
- The analysis contained in article relies on price action and chart formations. To learn more about price action or chart patterns, check out our DailyFX Education section.

In the effort of simplicity, I think the current matter in US equities can be boiled down to whether we’re seeing a bear market bounce at the open of a fresh quarter or whether we’re seeing positioning ahead of a possible Fed pivot.
Given the possible impact of inflation, I have a difficult time imagining much middle ground here. There’s one major factor of importance in the world right now and its raging inflation, which can up-end even developed economies if left unchecked. And given prior historical examples – it’s not usually a simple problem that just goes away. It usually takes years to draw out the excess capital reserves that built through a decade-plus of low rate regimes in the global economy. The alternative scenario would be a fast re-pricing in which inflation could quickly drop, but that would likely entail some considerable collateral damage, and even then, there’s a dearth of relevant near-term comps.
When inflation is low the central bank has considerable flexibility. And as we saw in the backdrop of the Financial Collapse, the pledge of continued-dovishness from the central bank can help to turn-around sell-offs and bring hope to markets that even difficult risks could be absorbed by the most loose and passive monetary backdrop that can be provided. This is what brought on the ‘Fed put,’ when investors expected the FOMC to counter adverse market conditions with more loose monetary policy.
But, for the first time since the early-80’s there’s the issue of inflation to contend with. So, the FOMC response that markets have become accustomed to in the low-inflation backdrop after the Global Financial Collapse is probably not the same. Because the previous response was something that may drive even more inflation.
But, this didn’t stop markets from putting in a rally in the second-half of March following the Fed’s first rate hike in this cycle. Stocks started to drop again around the Q2 open and continued the descent into the June rate decision – at which point the Fed did their first 75 bp hike since 1994. A day later, stocks bottomed and then bounced into quarter-end, and continued to rally for the next six weeks putting in a move that ran for about 18.92% and lasted for about two months in total.
This give and take has been a major driver of equities so far this year and the chart below shows each of these phases or waves. The big question is whether we’re now entering a period where markets will begin to position for a pivot from the Fed, similar to what was seen in the second-half of March or after the June FOMC rate decision.
S&P 500 Daily Chart
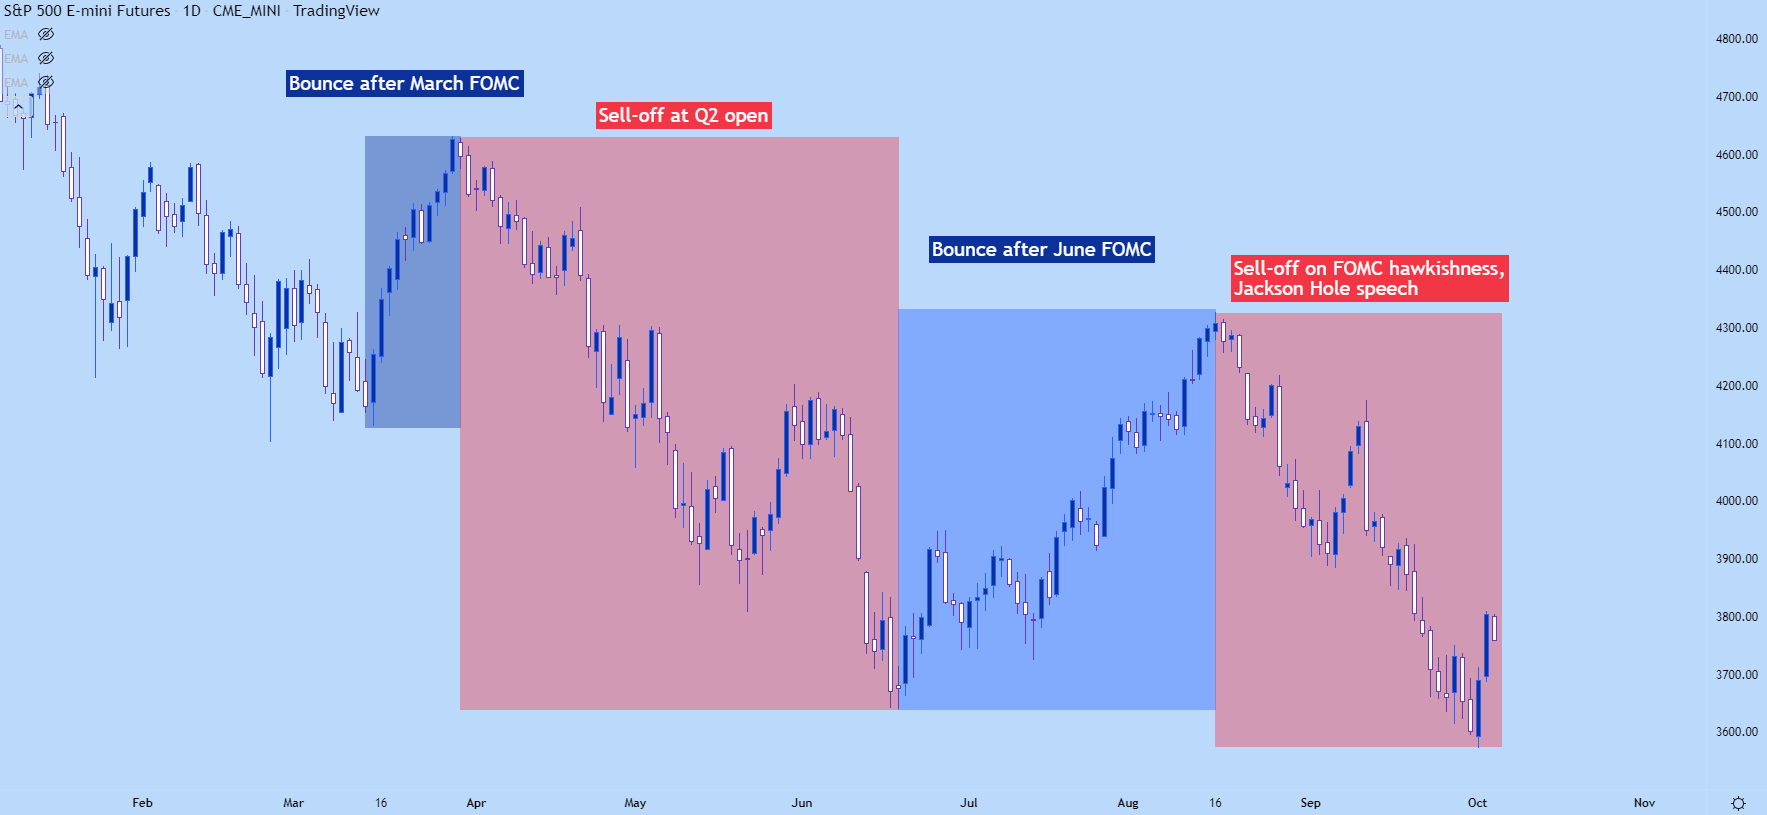
Chart prepared by James Stanley; S&P 500 on Tradingview
Is the Fed Making a Mistake?
A central core of the ‘Fed pivot’ argument seems to be the fact that market participants are convinced that the Fed is making a mistake by hiking as fast and aggressively as they are.
And to be sure, this may be true – the FOMC may trigger a recession with this fast rate of change in something as important as rate policy. But, this also may be somewhat by design as we’ve heard the bank continually say that they want a ‘soft landing.’ This does not necessarily pertain to the stock market though as the Fed’s task is to manage the economy – not the stock market. And while equity market implications may be important in a low-inflation backdrop, it’s probably less so in a high-inflation environment where consumers are constantly getting pinched.
The bigger mistake may be to take the gamble on inflation. If inflation continues to rise, the Fed has a pretty sure idea of what they’d be dealing with and there’s nothing good about that as the economy becomes more and more difficult to control.
And, in reality, the main mistake has already been made. That was not hiking while inflation was surging last year. The same recovery that the Fed was afraid of de-railing is what took on a life of its own as NFTs and highly speculative cryptocurrencies put in massive gains.
So, in short, the Fed may willingly make the mistake of hiking too much provided that it gets inflation under control – because they can quickly and easily move back to zero rate policy if need-be and given recent historical performance that’s had a fast reaction through markets. Conversely, pivoting now and taking the risk on inflation could put the Fed in a spot where they have very few options.

And in that scenario – when the story of inflation is written, the blame will appear to land squarely on the shoulders of the FOMC as they both avoided hiking when inflation was spiking and then stopped hiking too early. The Fed has two jobs – inflation and employment. Employment numbers have remained strong but inflation numbers are still far out of band. This is why I expect the Fed to continue hiking and it’s also why I retain a bearish lean on stocks. It’s also why employment data is incredibly important – because that seems to be the focal point that the bank is using to determine how impactful rate hikes have been thus far.
And this puts even more focus on this Friday’s NFP report, where we’ll get an updated unemployment rate along with Average Hourly Earnings, a sign of wage growth. And then next week brings on CPI so we’ll have more inflation data to work with. I talked about this with Christopher Vecchio in yesterday’s Analyst Chat.
S&P 500
The S&P 500 broke down to a fresh yearly low on Friday just ahead of quarter-end. But, there was a really big spot of support that was in-place towards the end of Q3 and that very much buffered the decline, leading to the build of a falling wedge formation. Those patterns are often approached with the aim of bullish reversals and through the first few days of Q4, that’s what we’ve had.
But, price has just found resistance at a major level of 3802 around mid-day in yesterday’s session. This is a confluent price, as it’s the 38.2% Fibonacci retracement of the pandemic-move and it’s also the 38.2% retracement of the recent sell-off move. This has helped to bring in a pullback overnight.

S&P 500 Daily Chart
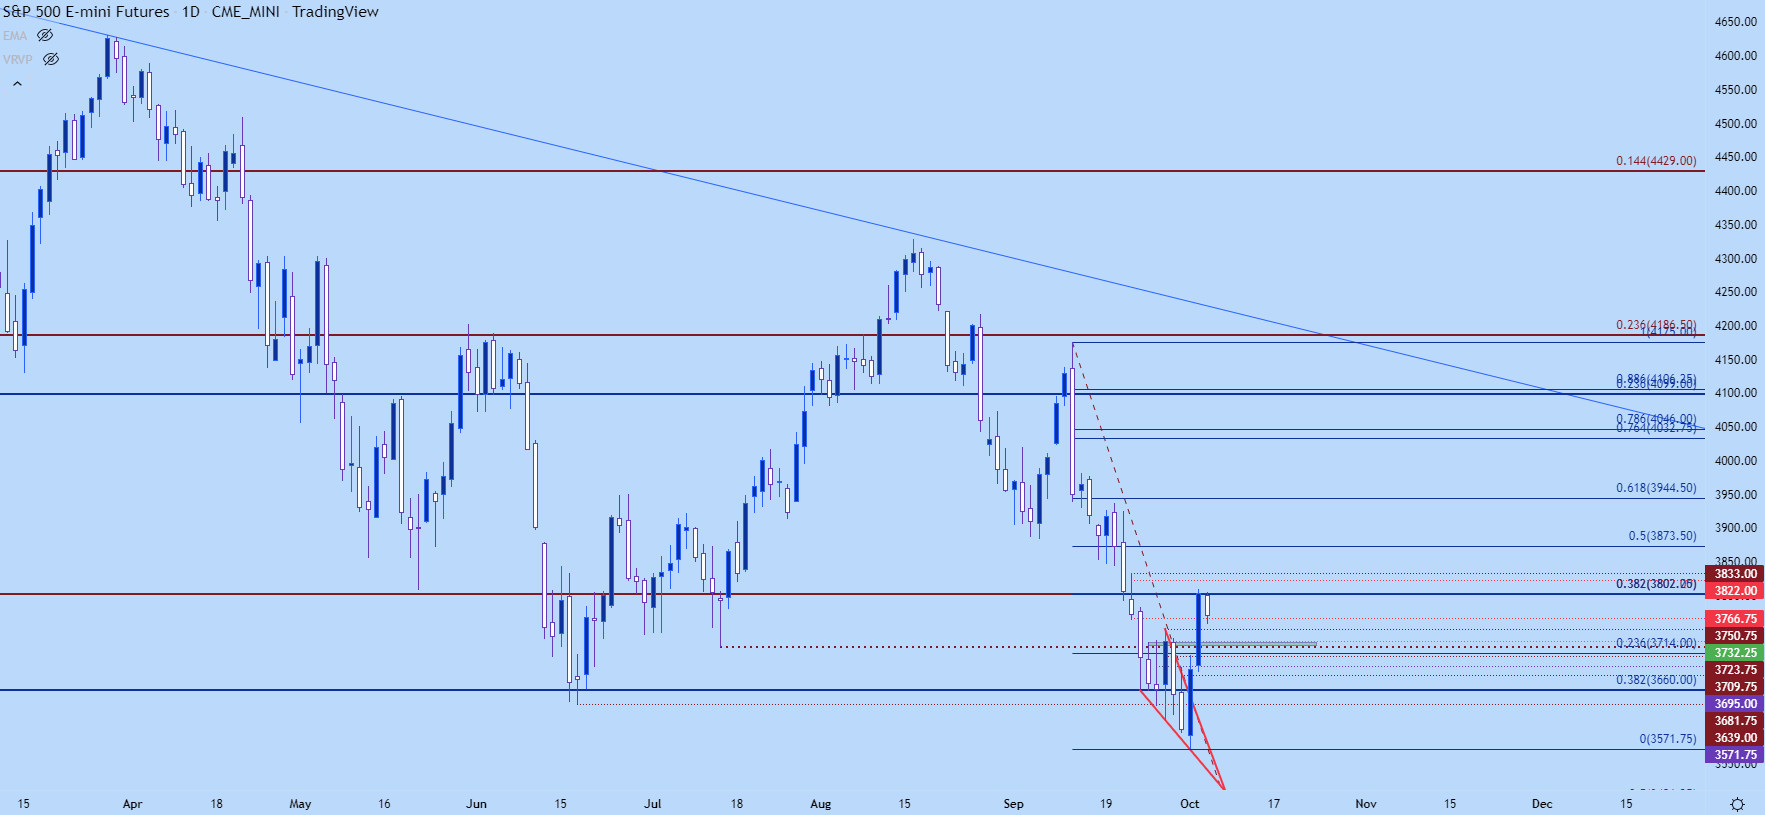
Chart prepared by James Stanley; S&P 500 on Tradingview
S&P 500 Shorter-Term
The challenge with trends is sentiment, and as far as timing is concerned, this probably has a much larger impact than many expect.
If all is bad and prices should be plummeting – but there’s nobody left to sell – then how will price go down?
It probably won’t right, because of the supply/demand equilibrium. For price to fall there needs to be fresh supply that dampens demand and price accordingly moves lower. But, if everyone that does want to sell is already short that downward movement can face challenges and it may, in fact, even be more of a bullish indication as a heavy batch of shorts will, at some point, need to close their positions. That means buying pressure (to cover shorts), and this is often why counter-trend bounces begin.
This also explains why trends aren’t linear, instead often showing a series of higher-highs and higher-lows or lower-lows and lower-highs, such as we teach in our price action section of DailyFX Education.
In the S&P 500, 3802 remains key and that’s currently holding the highs. The pullback has run down to a prior support swing and from the four-hour chart, there’s still scope for support. Bears will need to take that out in the coming days to re-take control of the matter, and given the NFP report on the calendar for tomorrow, there is some possible motive for such.
As for levels – I’m looking towards the prior resistance zone at 3723-3733 as being a marker of note, with a push below that showing greater drive from bears. There is a possible support swing before that zone, however, and that plots at the psychological level of 3750 and a hold of support there can keep the door open for bounce scenarios.
If bulls do force a higher-high, the next area of resistance that I’m tracking beyond 3802 is 3822 and 3833.
S&P 500 Four-Hour Price Chart
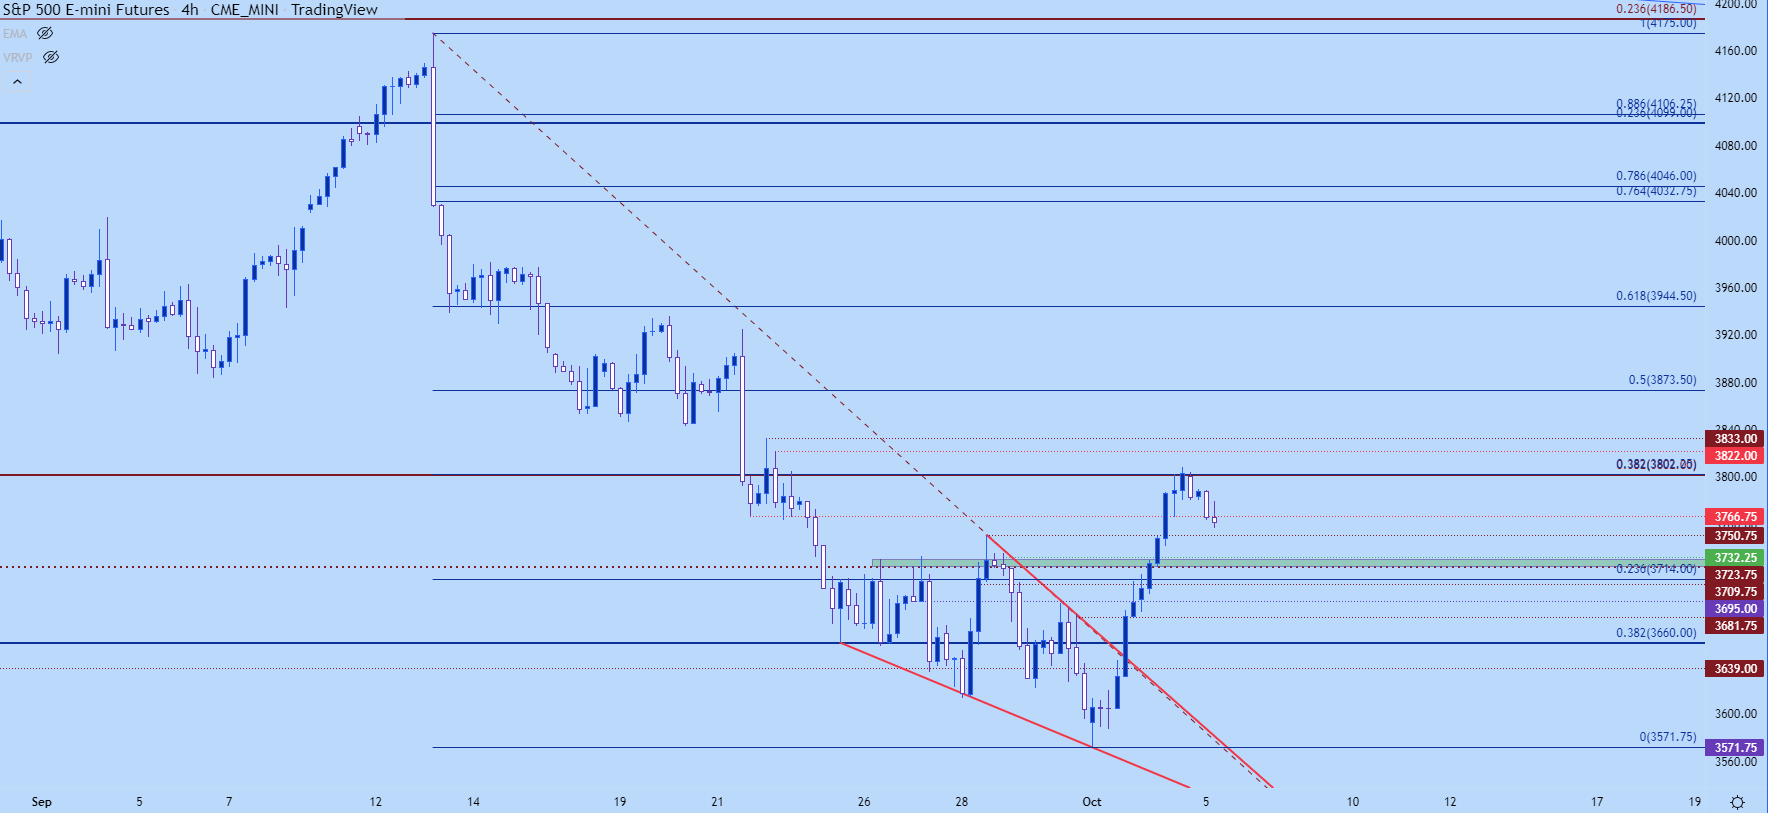
Chart prepared by James Stanley; S&P 500 on Tradingview
Nasdaq
The Nasdaq appears less clean to my eyes than the S&P 500. Like the S&P, the Nasdaq set a fresh yearly low on Friday and that continued into this week after futures began trading on Sunday night.
But, since then, bulls have forced a strong move and the weekly bar is currently showing a bullish engulf. Granted, we’re not even half-way through the week yet, but this does highlight a backdrop for continued bullishness, if buyers can force a breach back-above the Fibonacci level at 11,698. There’s some similar confluence around that price, as this is both the 50% retracement of the pandemic move and also 38.2% of the recent sell-off.
That’s a major line in the sand. And for bears – the same 11,294 level remains of note, as pushes below will show greater pull from sellers that can re-open the door for downside strategies.
Nasdaq Weekly Chart
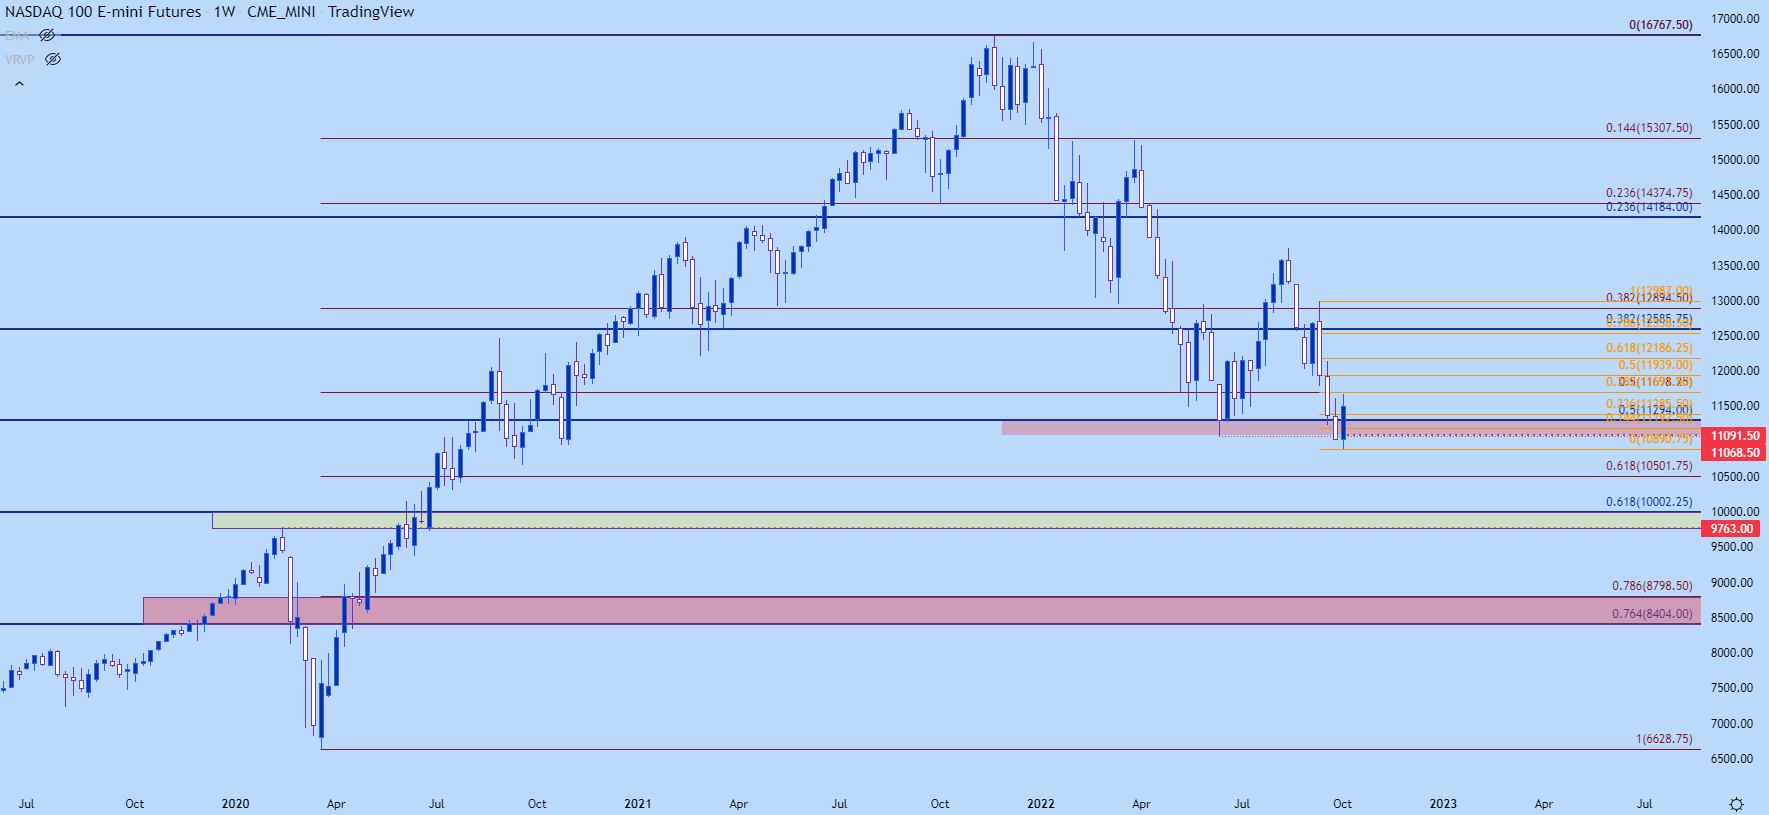
Chart prepared by James Stanley; Nasdaq 100 on Tradingview
Dow Jones
Last week the Dow looked to be in terrible shape. While the Nasdaq and S&P both remain above prior pandemic highs, the Dow fell below that level last week and continued to fall into quarter-end.
But, like the Nasdaq, the first couple days of Q4 price action have seen a strong bullish response with the weekly bar currently showing a bullish engulf formation, and the index is back above the 30k level.
The big question now is whether the Dow can continue to pull in fresh buyers above the big figure. There’s a confluent level sitting overhead, right around the 30,650 area of the chart. And for bears, a break back-below the 29,671 level will be key, as that would highlight a longer-term rejection of 30k along with a drop back-below the 38.2% Fibonacci retracement of the pandemic move.
Dow Jones Weekly Chart
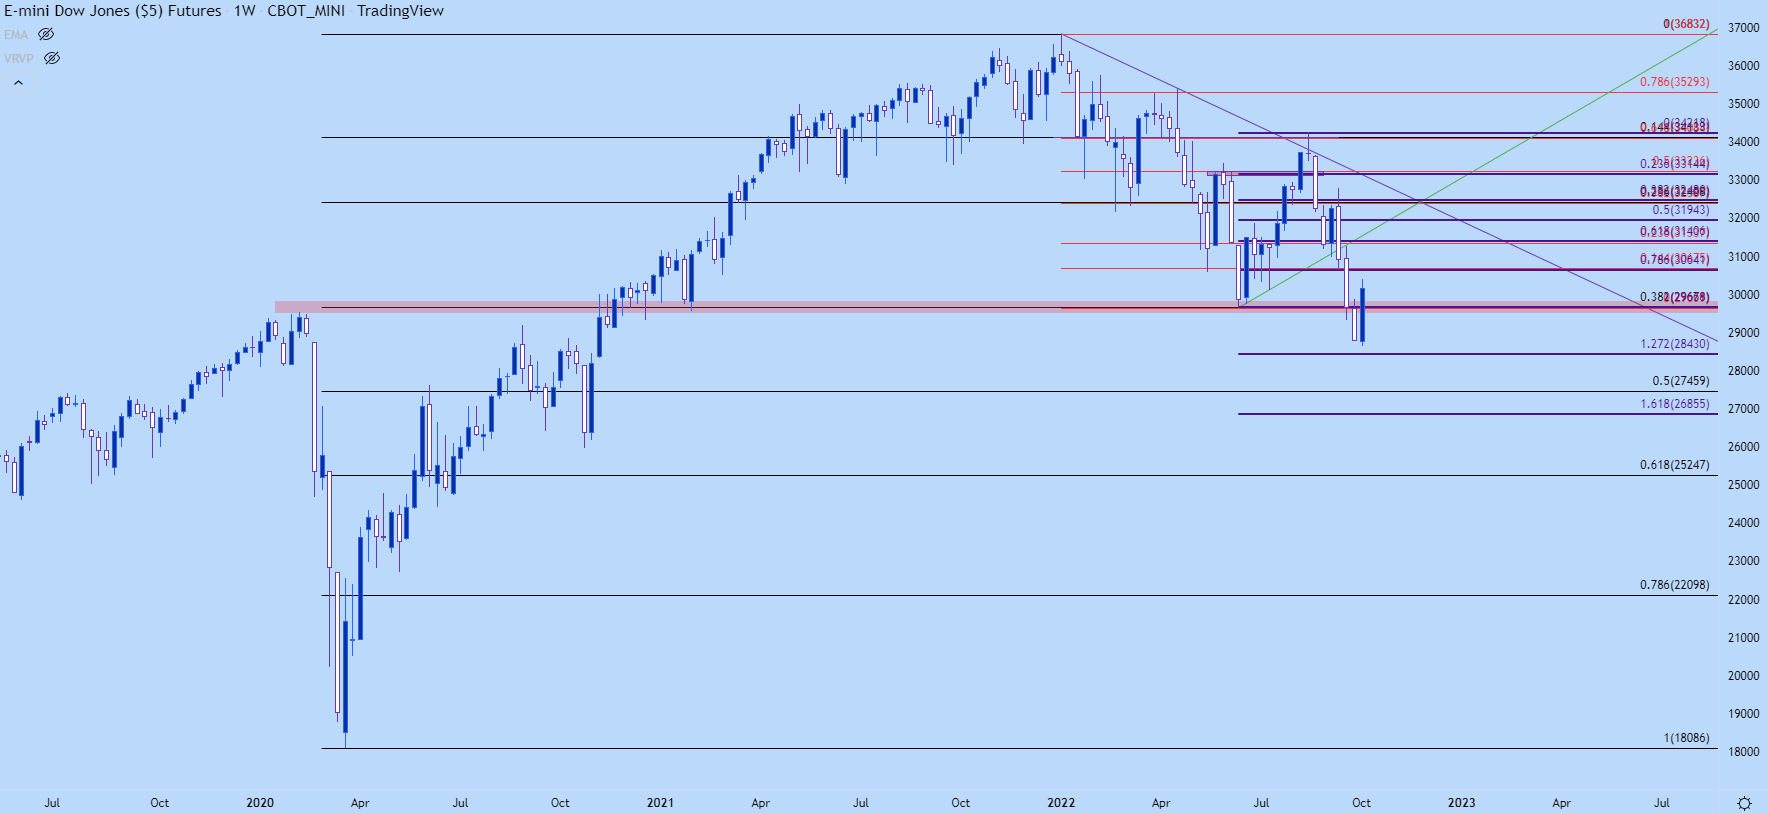
Chart prepared by James Stanley; Dow Jones on Tradingview
--- Written by James Stanley, Senior Strategist, DailyFX.com & Head of DailyFX Education
Contact and follow James on Twitter: @JStanleyFX


