


US Dollar Technical Price Outlook: DXY Weekly Trade Levels
- US Dollar recovery off multi-year up-trend in focus- yearly open support at 96.50
- DXY rally now testing 2019 trendline resistance
- USD long-bias vulnerable heading into long-term resistance at 97.87
The US Dollar rallied more than 0.27% this week with DXY trading at 97.61 ahead of the New York close on Friday. The gains mark the second consecutive-weekly advance in the greenback and takes the Dollar Index into the first region of targeted resistance. These are the updated targets and invalidation levels that matter on the US Dollar Index (DXY) weekly price chart. Review my latest Strategy Webinar for an in-depth breakdown of thesetrade setups and more.
US Dollar Price Chart – DXY Weekly
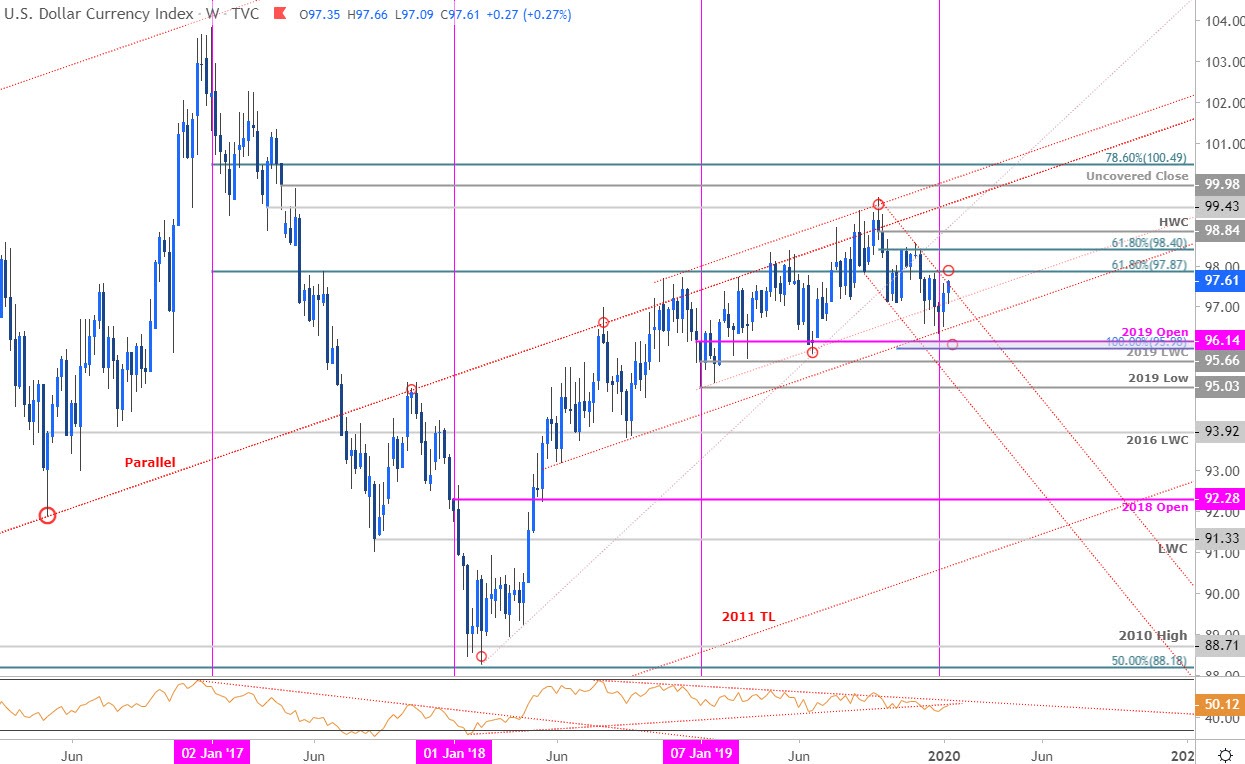
Chart Prepared by Michael Boutros, Technical Strategist; US Dollar Index on Tradingview
Notes: In my last US Dollar Weekly Price Outlook we noted that DXY was, “testing multi-year uptrend support into the open of 2020 trade.” That slope held into the open with the subsequent rebound now testing basic trendline resistance extending off the 2019 highs. It’s make-or-break heading into next week for the greenback.
A breach above this slope once again exposes a pivot zone at the 61.8% retracement of the 2017 decline at 97.87- a close above this threshold is needed to validate a larger reversal targeting 98.40 and the 2019 high-week reversal close at 98.84- both levels of interest for possible exhaustion IF reached. Weekly support rests with the objective yearly open at 96.50 – note that the lower parallel extending off the June 2018 low converges on this zone over the next two weeks. Critical support and broader bullish invalidation steady at the 100% extension / 2019 yearly open at 95.98-96.14 – look for a bigger reaction there IF reached.
For a complete breakdown of Michael’s trading strategy, review his Foundations of Technical Analysis series on Building a Trading Strategy
Bottom line: The US Dollar is testing multi-month downtrend resistance on this stretch and leaves the immediate advance vulnerable while below 97.87 heading into next week. From a trading standpoint, look for possible topside exhaustion into this zone- a good spot to reduce long-exposure / raise protective stops with a close above needed to keep the long-bias viable. I’ll publish an updated US Dollar Price Outlook once we get further clarity on the near-term DXY technical trading levels.

Previous Weekly Technical Charts
- Canadian Dollar (USD/CAD)
- Euro (EUR/USD)
- Australian Dollar (AUD/USD)
- Crude Oil (WTI)
- Japanese Yen (USD/JPY)
- Sterling (GBP/USD)
- Gold (XAU/USD)

--- Written by Michael Boutros, Technical Currency Strategist with DailyFX
Follow Michael on Twitter @MBForex


