


Dow Jones, S&P 500, DAX 30, and FTSE 100Technical Forecast:
- The S&P 500 and Dow Jones tread water above nearby resistance as bulls set their sight on new all-time highs
- The DAX 30 finds itself comfortably within its upward channel from January
- The FTSE 100 rests narrowly beneath resistance from mid-February
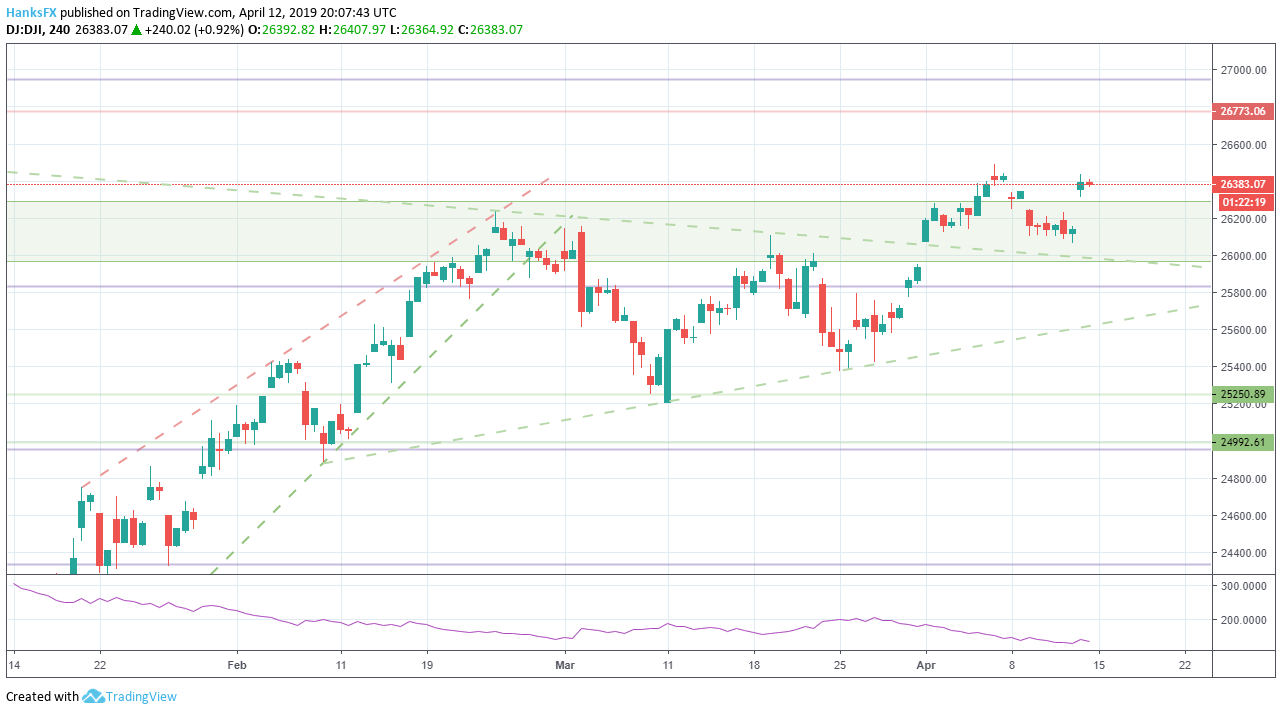
Dow Jones Technical Forecast: Bullish
The Dow Jones gapped higher on Friday as a notable component of the Industrial Average – Disney – soared to all-time highs. With a daily close above the recent band of resistance at 26,295, the index should now look to use the level as support. Beneath that lies a support trendline from October that recently acted as the topside of a wedge from February to its break on April 1.
Learn the differences between the Dow Jones and S&P 500 and how they might contribute to different outlooks.
With considerable support beneath the index, the topside shows promise. Apart from the swing high on April 5 at 26,490, immediate resistance is less clear. That said, 26,773 – September’s high – should offer some resistance before the Average tests record highs at 26,942.
Dow Jones Price Chart: 4-Hour Time Frame (January 2019 to April 2019) (Chart 1)
How to day-trade the Dow Jones
S&P 500 Technical Forecast: Bullish
Similarly, the S&P 500 gapped higher at Friday’s open on positive earnings from JP Morgan, Wells Fargo and PNC Bank. In turn, the index ran to topside a resistance trendline dating to December 24. Price action has been wrapping around the line like a vine, suggesting it still holds some sway. It will pose the first top-side barrier for a move higher in the week ahead.
Beyond that, horizontal resistance at 2,916 – September’s high – is another risk to a move higher. Should both topside levels be beaten, the final hurdle is the index’s record high at 2,942. As far as support is concerned, the S&P 500 has ample. Prior resistance at 2,870 from the high in February 2018 should now offer buoyancy on an attempted move lower, followed by March’s high at 2,860.
S&P 500 Price Chart: 4 – Hour Time Frame (January 2019 – April 2019) (Chart 2)

DAX 30 Technical Forecast: Neutral
The German DAX 30 finds itself on the topside of its upward channel from January. Given the positioning of the index within its channel, and its stellar run-up two weeks ago, consolidation or a minor retracement may be needed before another topside test is attempted.
The channel’s upper bound appears to be the sole resistance, with the index’s current price marking the high during a period of consolidation amidst October’s rout. Should the index open above 12,000 on Monday, the level could offer some buoyancy during the week. 11,841 marks another October high and lies in an open gap from two weeks ago. In the week ahead, it should provide some support if it is tested before the lower-bound of the channel.
DAX 30 Price Chart: 4 – Hour Time Frame (December 2018 – March 2019) (Chart 3)

FTSE 100 Technical Forecast:Neutral
The FTSE 100 closed Friday’s session slightly beneath trendline resistance from mid-February. Although the line has been broken in prior sessions, it provided clear-cut resistance during Thursday and Friday trading which suggests it should continue to do so next week. It will be the first barrier to a topside move.
For support, the index will rely on the 61.8% Fib level at 7,382. Beneath that lies a support trendline from December 24 lows which has not been broken since its inception. Like the DAX, the FTSE may look to consolidate above the 61.8% Fib level before another test at topside resistance. A daily close above the line would see it act as support as the week progresses. For more equity technical levels, follow @PeterHanksFX on Twitter.
Looking for a fundamental perspective on equity? Check out the Weekly Equity Fundamental Forecast.
FTSE 100 Price Chart: 4 – Hour Time Frame (June 2018 – March 2019) (Chart 4)

--Written by Peter Hanks, Junior Analyst for DailyFX.com
Contact and follow Peter on Twitter @PeterHanksFX
DailyFX forecasts on a variety of currencies such as the Pound or the Euro are available from the DailyFX Trading Guides page. If you’re looking to improve your trading approach, check out Traits of Successful Traders. And if you’re looking for an introductory primer to the Forex market, check out our New to FX Guide.
Other Weekly Technical Forecast:
Australian Forecast– AUDUSD Flirts with 200 Day Moving Average, AUDJPY Earns Strong Break
Crude Oil Forecast – Will Pres. Trump Tweet at $65?
Sterling Forecast – GBPUSD, EURGBP and GBPJPY
US Dollar Forecast – USD Searches for Direction Amidst Wedge
Gold Forecast – XAU Doji Threatens Deeper Losses
Euro Forecast – EUR/USD Attracts Bears, But Price Momentum May Reverse Higher


