


US Dollar Technical Highlights:
- Big-picture wedge continues to develop
- Solid top and bottom-side levels to watch
Check out the DailyFX Trading Guides page for intermediate-term forecasts, educational content aimed all experience levels, and more!
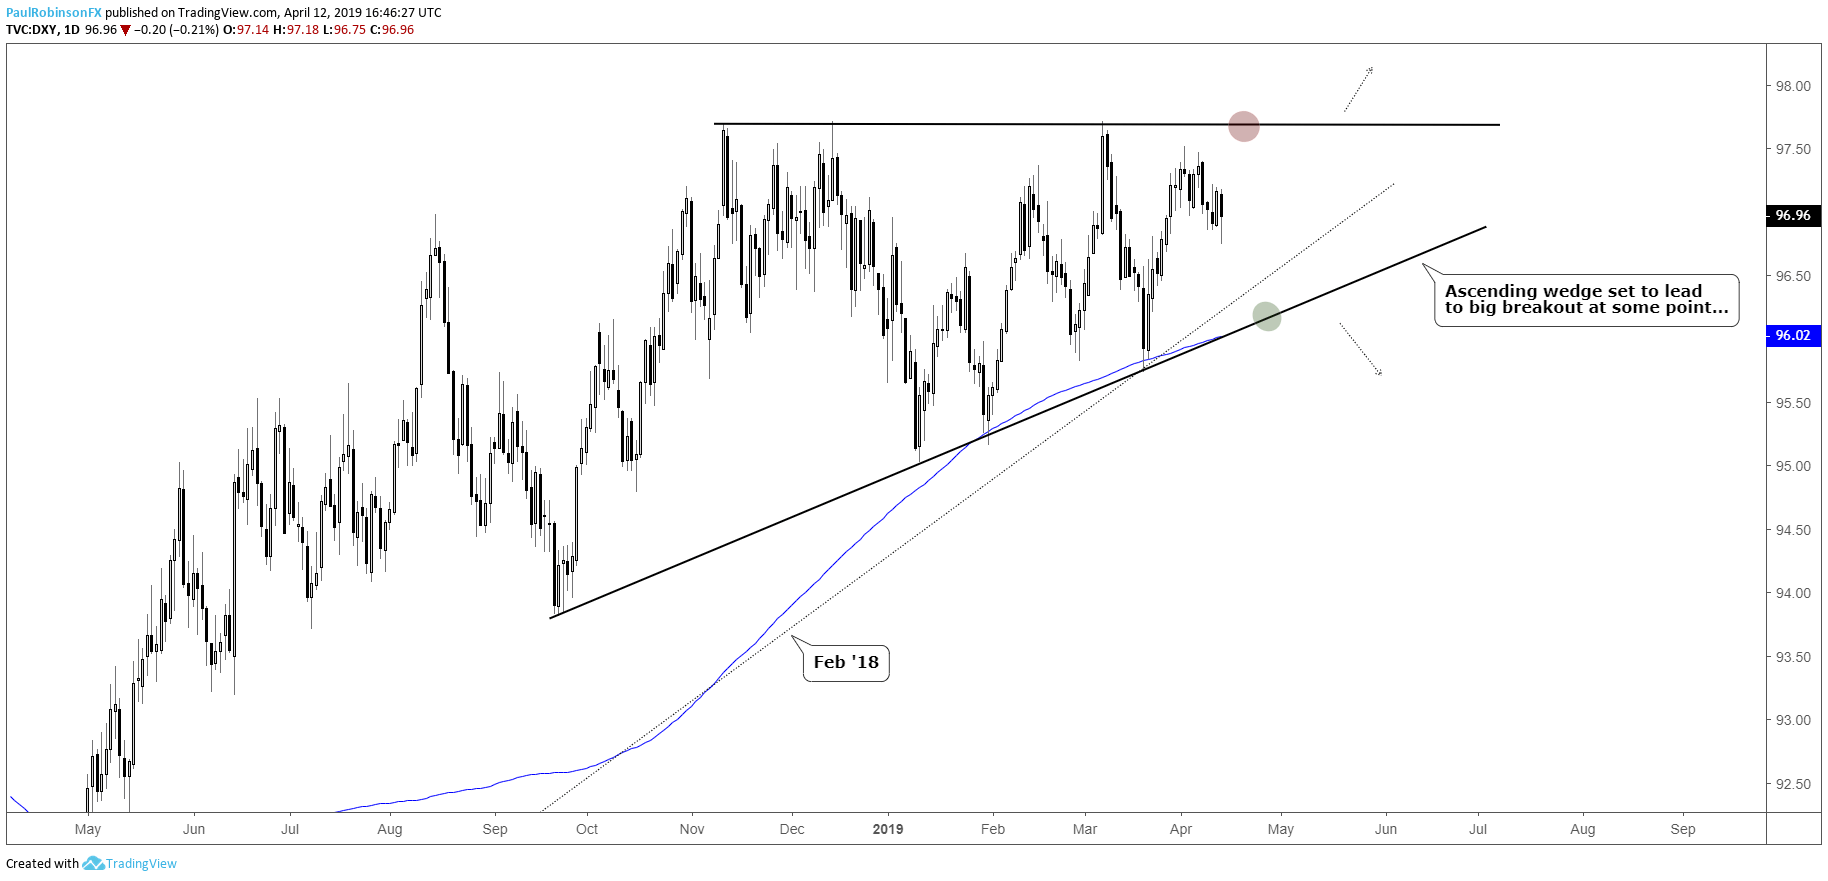
Big-picture wedge continues to develop
The US Dollar continues to be a difficult market for traders as low volatility puts a strangle-hold on the trading environment. Looking at the big-picture ascending wedge developing it is well within reason to expect more of the same for a little while longer as the pattern continues to fill out towards its apex.
This doesn’t mean there won’t be room for opportunities or for a surprise move as low-vol is indicative of complacency among market participants. With that said, though, patience and trade selectively will be the key until a more fertile trading environment develops.
The two primary points of interest are the top-side horizontal line crossing over peaks since November and the underside trend-line of wedge, which also happens to be in confluence with the rising 200-day MA. There is another trend-line running up from early 2018, but of lesser importance than the one just beneath it.
For now, the thinking is to look for fade-trades off one of the aforementioned levels once momentum turns in the other direction. Should one side break (top-side looking most likely) then the game-plan will pivot towards running with the breakout as volatility may finally see a pop.
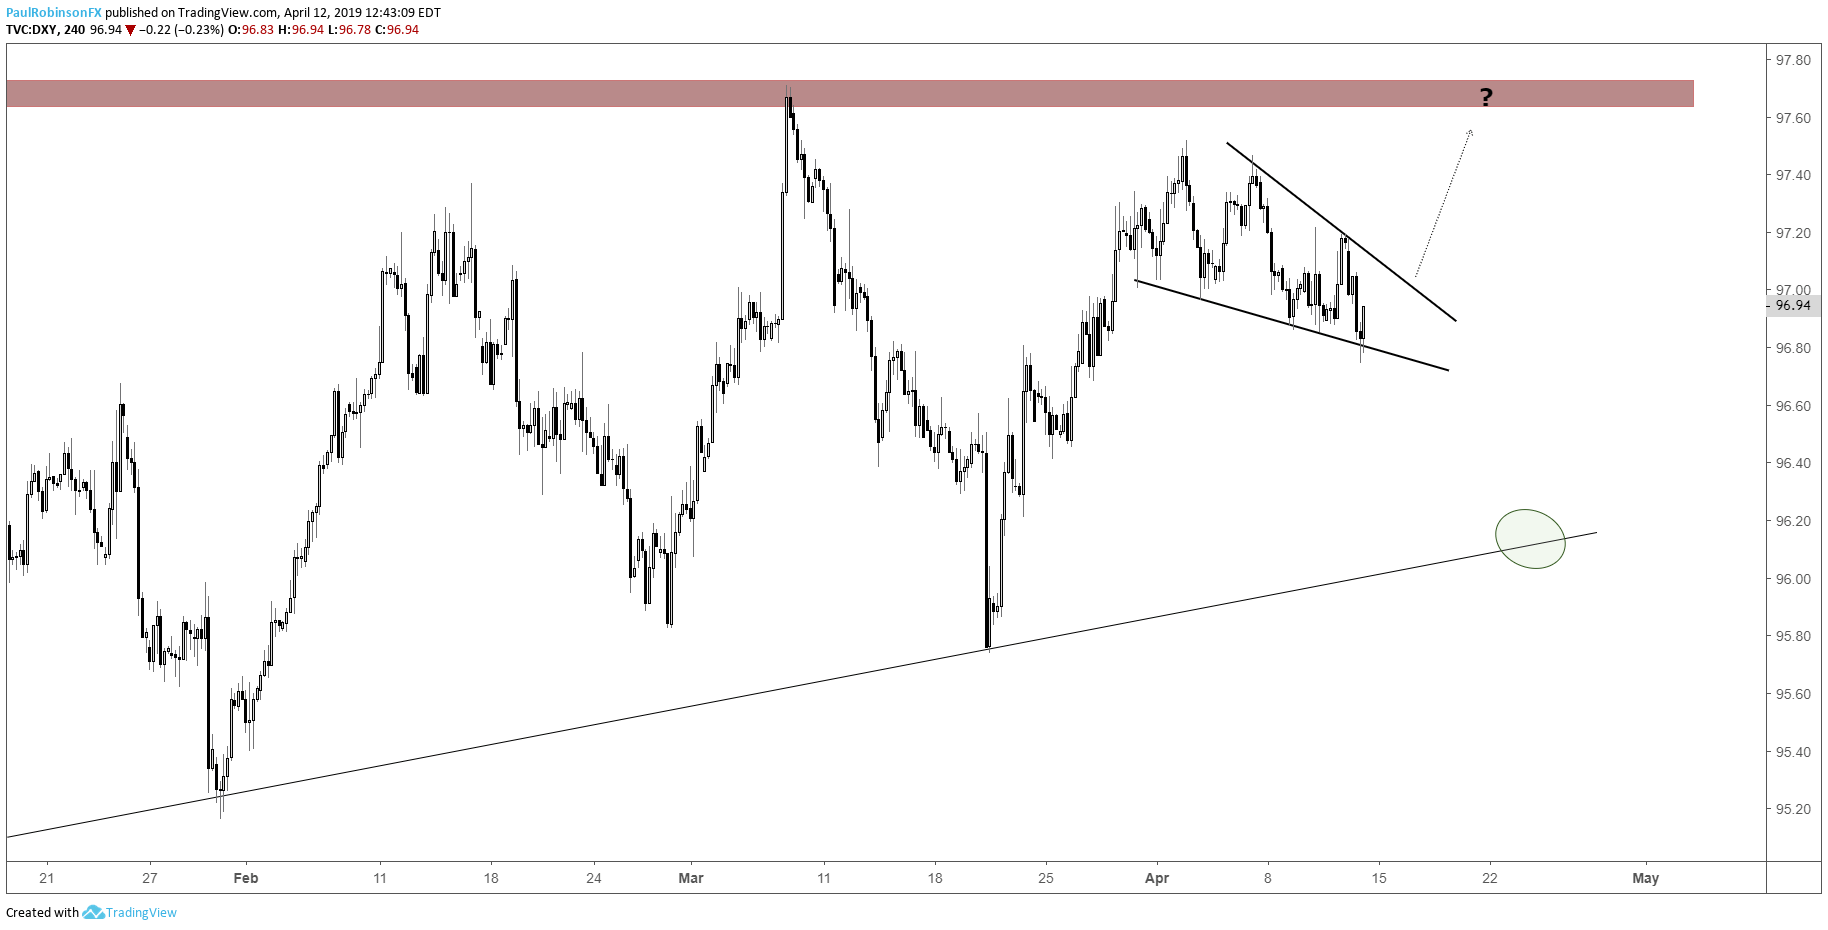
What may push the DXY into resistance early this coming week, is a falling wedge on the 4-hr time-frame. It may not trigger its top-side trend-line so waiting for an actual breakout is crucial. Given its close proximity to the 97.60s this is likely to only hold a small amount of potential before price could reverse off big resistance.
Check out the IG Client Sentiment page to find out how changes in positioning in major markets could signal the next price move.
DXY Daily Chart (Wedge continues to build…)
Looking for a fundamental perspective on the USD? Check out the Weekly USD Fundamental Forecast.
DXY 4-hr Chart (Short-term falling wedge)
Helpful Resources for Forex Traders
Whether you are a new or experienced trader, we have several resources available to help you; indicator for tracking trader sentiment, quarterly trading forecasts, analytical and educational webinars held daily, trading guides to help you improve trading performance, and one specifically for those who are new to forex.
---Written by Paul Robinson, Market Analyst
You can follow Paul on Twitter at @PaulRobinsonFX
Other Weekly Technical Forecast:
Australian Forecast– AUDUSD Flirts with 200 Day Moving Average, AUDJPY Earns Strong Break


