


Crude Oil Talking Points:
- Oil Prices Susceptible to Larger Pullback on Looming RSI Sell Signal.
- Crude Oil Price Remains Firm as OPEC Cuts Curb Oversupply.
- Crude Oil Analysis: Oil Prices Most Overbought Since Q4 Crash.
Crude Oil Crafts Fresh 2019 High, then Meanders
Crude Oil Price Forecast: Bullish
It’s been another big week for Oil prices, and this comes despite the fact that the bulk of the period was spent with price action meandering between short-term support and resistance. But, the week started with a bang as prices continued a Friday breakout, running up to fresh five-month highs and making a fast run before falling short of the $65 level. This keeps bulls in the driver’s seat in Oil, with trend continuation scenarios remaining as one of the more attractive ways of approaching the matter at this point.
Oil Price Four-Hour Chart: Bullish 2019 Trends Hasten While Extending
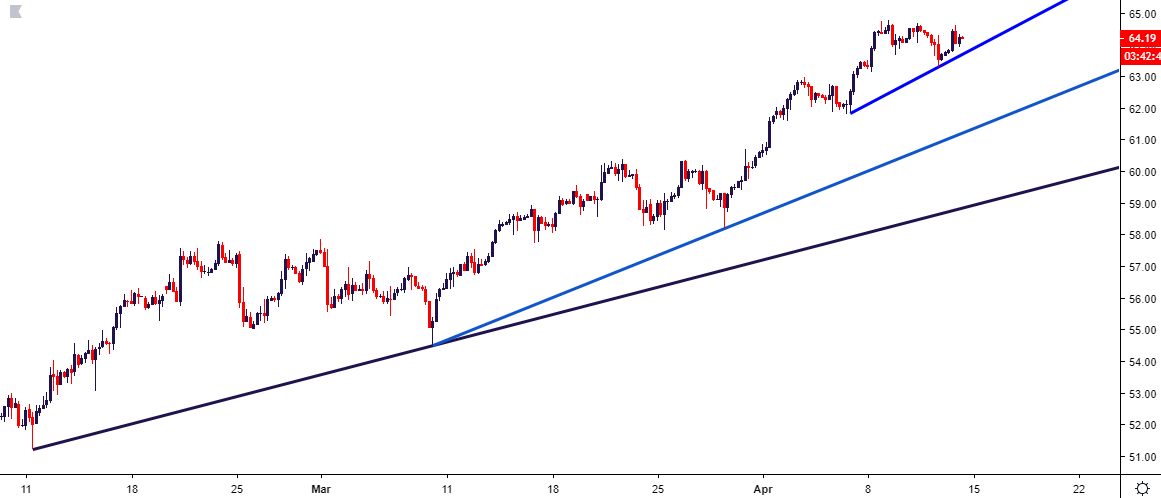
Chart prepared by James Stanley
Looking for a fundamental perspective on oil? Check out the Weekly Oil Fundamental Forecast.
Timing in Bullish Oil Trends
The primary complication at this point is one of entry, as the area around $65 has a few different reasons to slow down the advance and this may be one of the primary reasons that buyers pulled back on the throttle as this zone came near. At 64.50 we have a prior swing-low from August of last year, and that support swing was aided by a Fibonacci level at 64.89, which is the 23.6% retracement of the 2016-2018 major move. And then, of course, at $65 we have a major psychological level, and this is something that’s taken on greater importance of recent as President Donald Trump has opined on the matter of recent.
Will a test above the $65 handle elicit the ire of President Trump, similar to what happened with Crude in late-February, which then provoked a pullback from resistance to support?
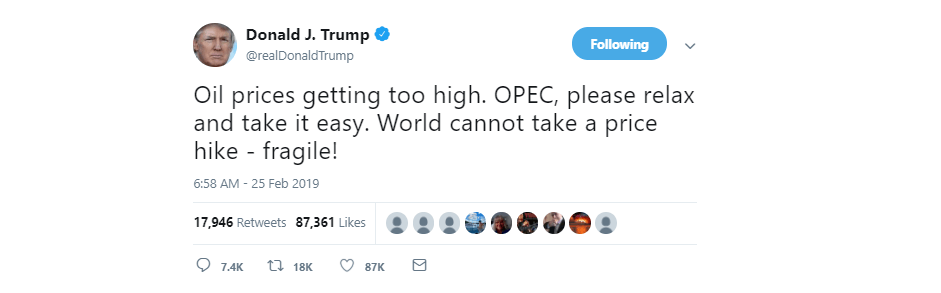
That potential for a threat has been enough, at least at this point, to help resistance hold inside of the psychological level as buyers have continued to shy away from a test of the big figure.
Oil Price Daily Price Chart
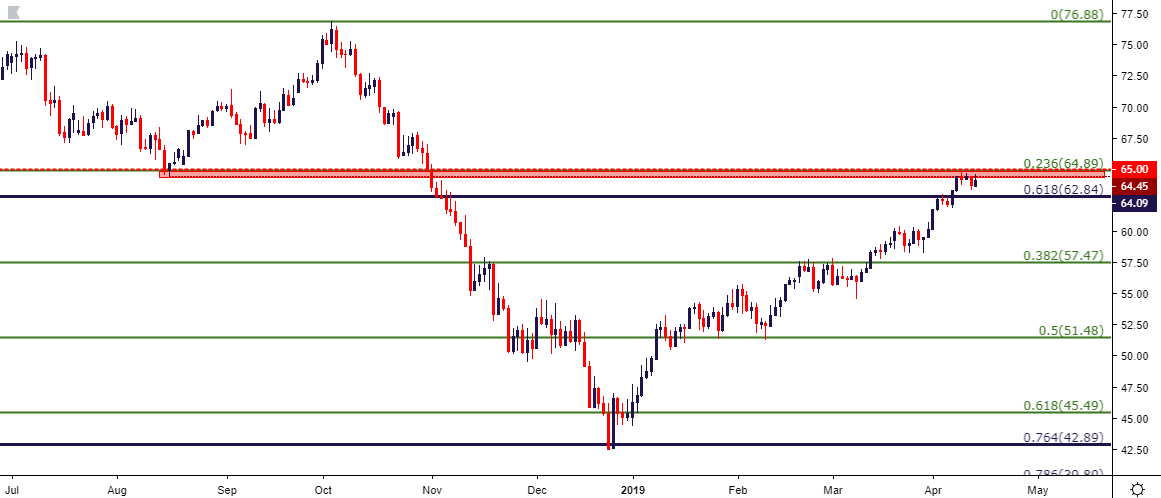
Chart prepared by James Stanley
Oil Prices and Higher-Low Support Potential: Wash, Rinse, Repeat
More interesting for Oil prices right now is the continuation of the bullish trend, and with such strategies, catching higher-low support for topside trend continuation is key. This can allow for cogent risk management so that if that higher-low element of support does not hold, losses can be mitigated, and the trader can simply look to evaluate the setup later.
And given the bullish trajectory of Oil prices so far this year, there are a couple of different areas in which this might take place.
Early-April resistance came in from another Fibonacci level at 62.84, as this is the 61.8% retracement of the 1998-2008 major move. Prices broke beyond this level on Friday and, to date, there hasn’t yet been a follow-through test of support. This can be connected up to the Monday swing-low at 63.11 to create a nearby support zone. A deeper zone could be followed around a set of swing-lows from last week, taken from 61.58 up to 61.87. And below that, we have the big area of prior March resistance that runs from the psychological level of 60 up to 60.35.
Crude Oil Four-Hour Price Chart
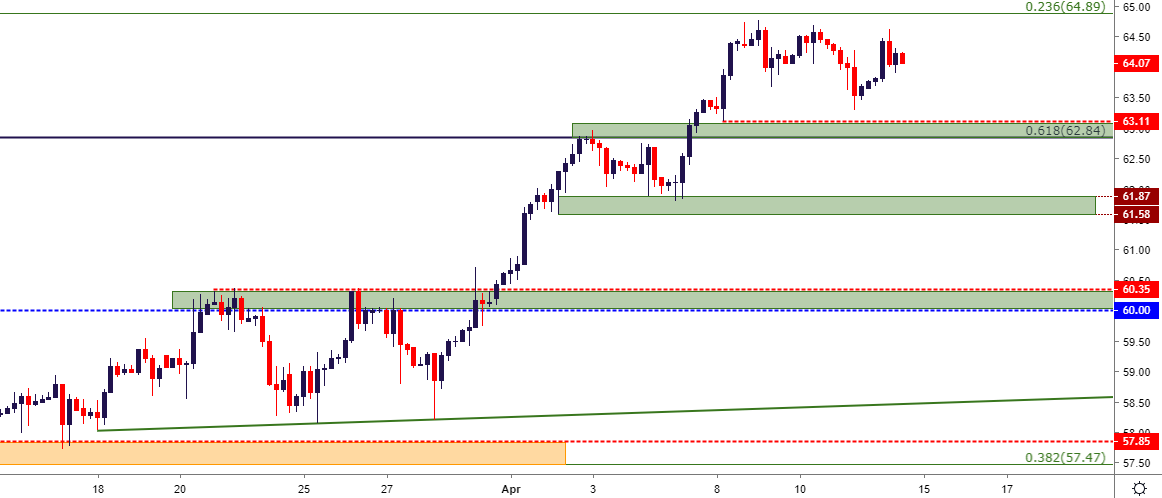
Chart prepared by James Stanley
To read more:
Are you looking for longer-term analysis on the U.S. Dollar? Our DailyFX Forecasts for Q1 have a section for each major currency, and we also offer a plethora of resources on USD-pairs such as EUR/USD, GBP/USD, USD/JPY, AUD/USD. Traders can also stay up with near-term positioning via our IG Client Sentiment Indicator.
Forex Trading Resources
DailyFX offers an abundance of tools, indicators and resources to help traders. For those looking for trading ideas, our IG Client Sentiment shows the positioning of retail traders with actual live trades and positions. Our trading guides bring our DailyFX Quarterly Forecasts and our Top Trading Opportunities; and our real-time news feed has intra-day interactions from the DailyFX team. And if you’re looking for real-time analysis, our DailyFX Webinars offer numerous sessions each week in which you can see how and why we’re looking at what we’re looking at.
If you’re looking for educational information, our New to FX guide is there to help new(er) traders while our Traits of Successful Traders research is built to help sharpen the skill set by focusing on risk and trade management.
--- Written by James Stanley, Strategist for DailyFX.com
Contact and follow James on Twitter: @JStanleyFX
Other Weekly Technical Forecast:
Australian Forecast– AUDUSD Flirts with 200 Day Moving Average, AUDJPY Earns Strong Break


