


- Updated weekly technicals on Gold – price vulnerable near-term while below 1302
- Check out our 2019 projections in our Free DailyFX Gold Trading Forecasts
- Join Michael for Live Weekly Strategy Webinars on Mondays at 12:30GMT
Gold prices are posed to snap a four-week winning streak with the precious metal down 0.33% to trade at 1283 ahead of the New York close on Friday. Here are the key targets & invalidation levels that matter on the Gold (XAU/USD) weekly chart.
New to Gold Trading? Get started with this Free How to Trade Gold -Beginners Guide
Gold Weekly Price Chart (XAU/USD)
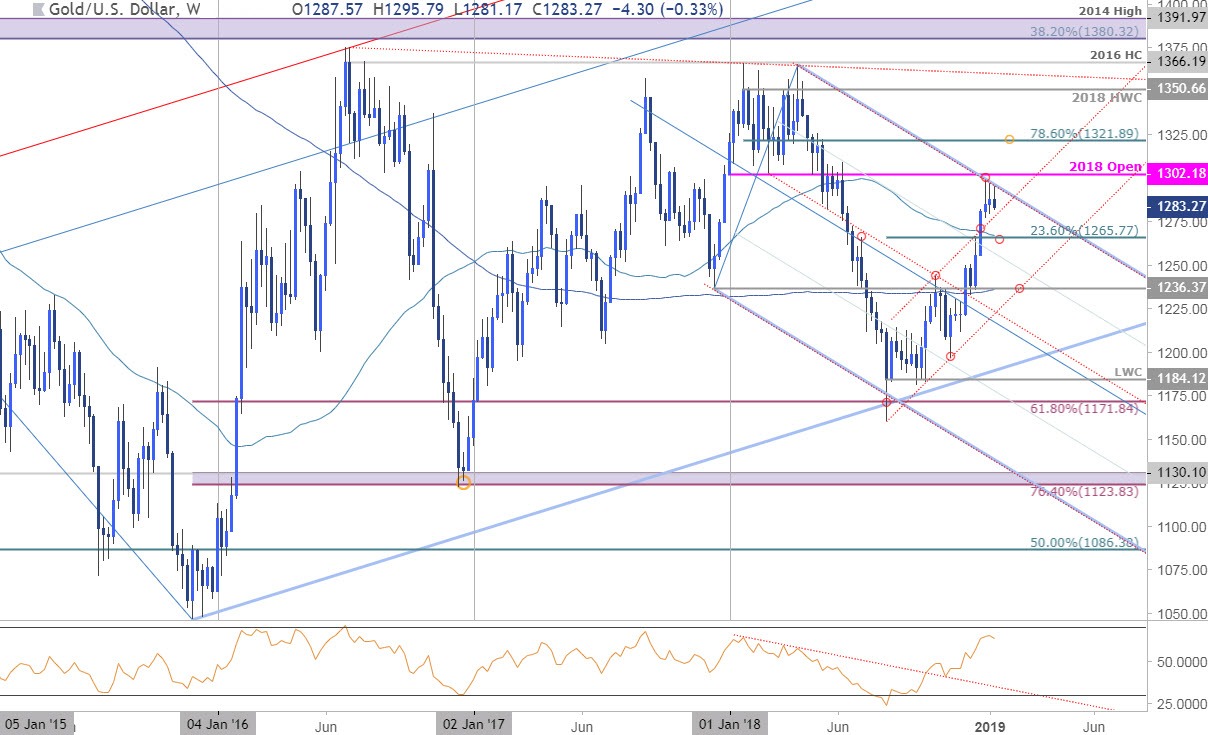
Notes:In my previous Gold Technical Outlook we noted that the price recovery was, “testing the first major test of confluence resistance just ahead of the 2018 open at 1302 – a close above this region is needed to keep the immediate advance viable. IF price is going to pullback- this would be the post.” Gold failed at slope resistance yet again this week with prices poised to mark the first weekly loss since mid-December.
Daily support rests at the confluence of the 52-week moving average and the 23.6% retracement of the August advance at 1266/67- a move below this threshold would risk a larger correction in price with broader bullish invalidation steady at 1236, “where the 200-week moving average and December 2017 low converge on channel support.” A breach above 1302 still needed to validate the breakout with such a scenario eyeing initial Fibonacci resistance at 1322.
For a complete breakdown of Michael’s trading strategy, review his Foundations of Technical Analysis series on Building a Trading Strategy
Bottom line:A near-term price consolidation looks to have broken late in the week and leaves the immediate risk lower while below pitchfork resistance. From a trading standpoint, the focus is on a reaction down at the yearly open / monthly opening range. Ultimately, a larger set-back may offer more favorable long-entries closer to weekly support. Review my latest Gold Price Outlook for a closer look at the near-term trading levels.
Gold Trader Sentiment
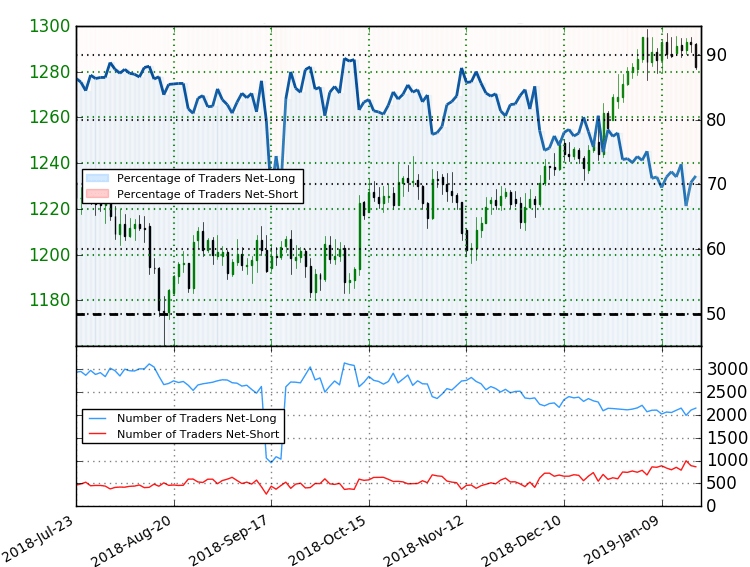
- A summary of IG Client Sentiment shows traders are net-long Gold - the ratio stands at +2.61 (72.3% of traders are long) – bearish reading
- Long positions are 3.7% higher than yesterday and 3.6% higher from last week
- Short positions are 13.6% lower than yesterday and 6.8% lower from last week
- We typically take a contrarian view to crowd sentiment, and the fact traders are net-long suggests Gold prices may continue to fall. Traders are further net-long than yesterday & last week, and the combination of current positioning and recent changes gives us a stronger Gold-bearish contrarian trading bias from a sentiment standpoint.
See how shifts in Gold retail positioning are impacting trend- Learn more about sentiment!
--- Written by Michael Boutros, Technical Currency Strategist with DailyFX
Follow Michael on Twitter @MBForex
Other Weekly Technical Forecasts:
Australian Dollar Forecast: AUD/USD, AUD/CAD Prepare for Next Big Moves as AUD/JPY May Reverse
British Pound Forecast:Taking a Post-Rally Breather
Equity Forecast: S&P 500 Upside Limited, DAX Makes Topside Breach
Crude Oil Forecast: Trading Higher Against 2019's Wall of Worry


