


- Gold prices in consolidation just below key resistance at 1302- constructive above 1275
- Check out our 2019 projections in our Free DailyFX Gold Trading Forecasts
- Join Michael for Live Weekly Strategy Webinars on Mondays at 12:30GMT
Gold prices have continued to consolidate within the initial January opening range just below technical resistance and we’re looking for the break. These are the updated targets and invalidation levels that matter on the XAU/USD charts. Review this week’s Strategy Webinar for an in-depth breakdown of this setup and more.
New to Gold Trading? Get started with this Free How to Trade Gold -Beginners Guide
Gold Daily Price Chart (XAU/USD)
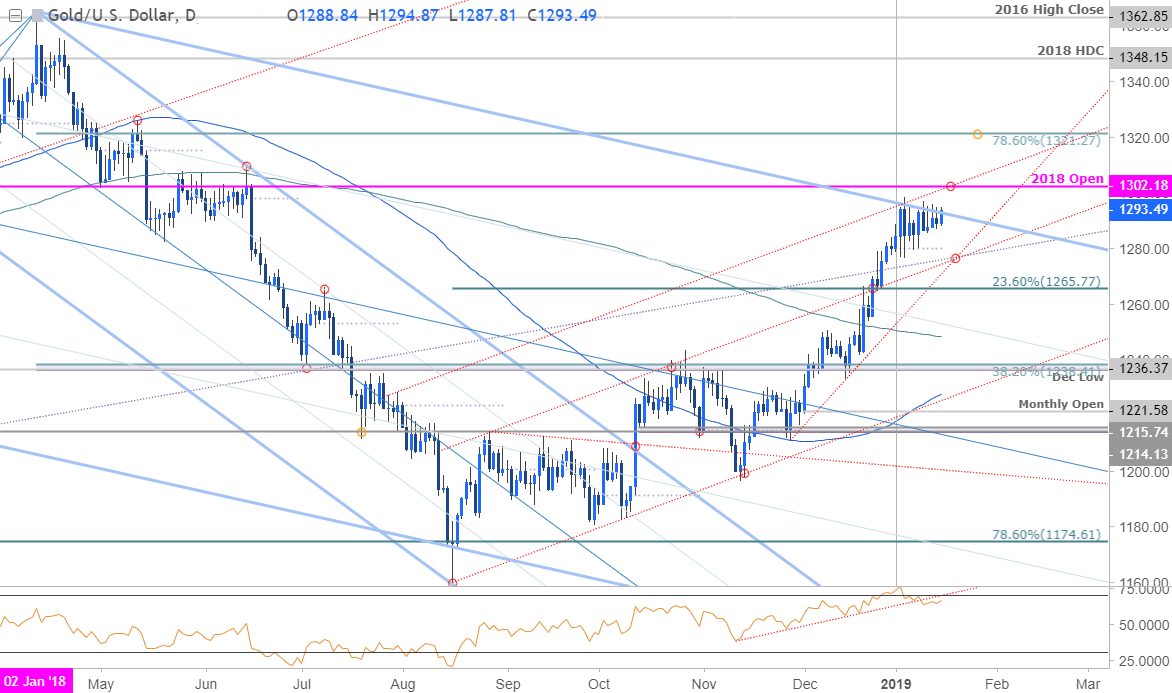
Technical Outlook: In my latest Gold Weekly Technical Outlook we noted that the breakout was, “testing the first major test of confluence resistance just ahead of the 2018 open at 1302 – a close above this region is needed to keep the immediate advance viable.” Price has set the monthly opening-range just below long-term pitchfork resistance (blue) extending off the 2018 high with a near-term consolidation range still in play.
Why does the average trader lose? Avoid these Mistakes in your trading
Gold 240min Price Chart (XAU/USD)
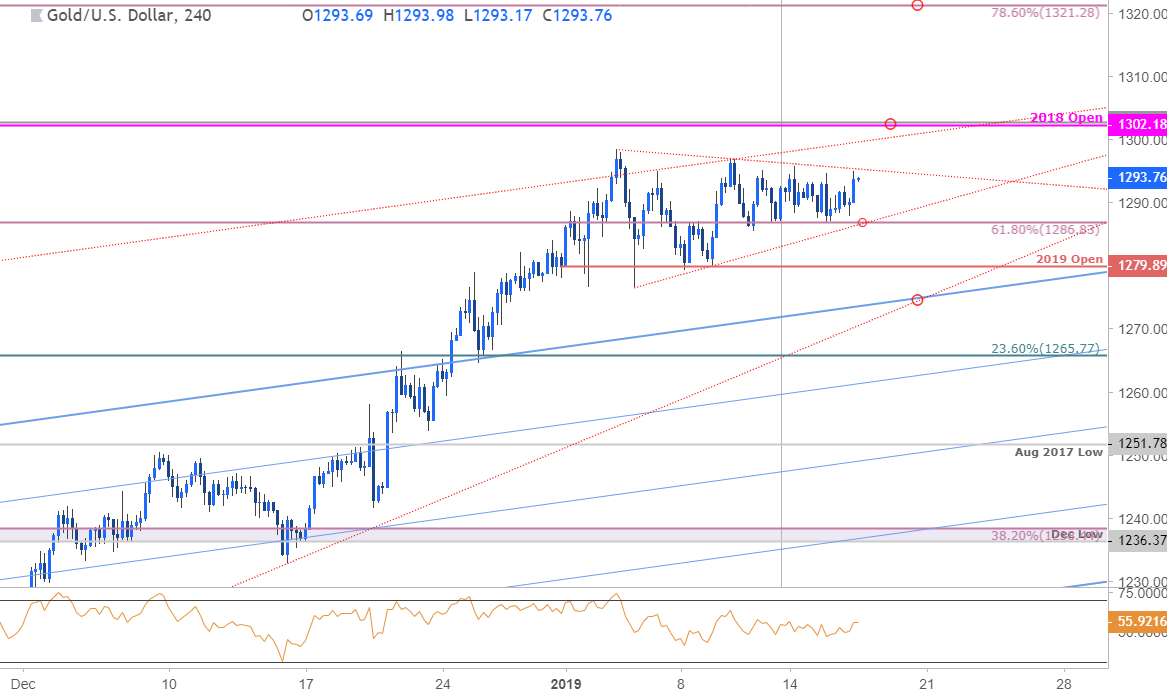
Notes: A closer look at price action shows gold continuing to trade within a consolidation range since the start of the year with immediate support eyed at the weekly opening-range low / 61.8% retracement of the 2018 range at 1286. A topside break looks to challenge confluence resistance at 1302- a breach there is needed to mark resumption of the broader uptrend with such a scenario targeting 1321.
A downside break of the formation exposes yearly open support at 1280 backed by the trendline confluence around 1275- an area of interest for possible exhaustion / long-entries. We’ll reserve this threshold as our near-term bullish invalidation level with a break below risking a larger price correction towards the 23.6% retracement at 1265.
Learn how to Trade with Confidence in our Free Trading Guide
Bottom line: The broader focus is higher in gold, but the immediate advance remains vulnerable sub-1302. Note that the objective monthly opening-range remains intact and we’re looking for the break for guidance. From a trading standpoint, the ideal scenario would be for this range to resolve higher only to fail an attempt to breach 1300 – ultimately a larger pullback would offer more favorable long-entries targeting a topside break of this multi-year pitchfork resistance.
For a complete breakdown of Michael’s trading strategy, review his Foundations of Technical Analysis series on Building a Trading Strategy
Gold Trader Sentiment
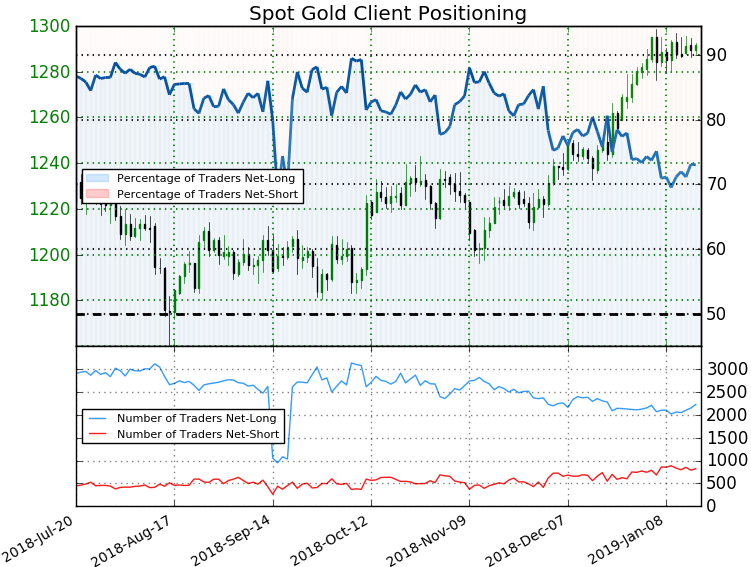
- A summary of IG Client Sentiment shows traders are net-long Gold - the ratio stands at +2.71 (73.0% of traders are long) – bearishreading
- Long positions are2.6% higher than yesterday and 4.6% higher from last week
- Short positions are 6.6% lower than yesterday and 8.0% lower from last week
- We typically take a contrarian view to crowd sentiment, and the fact traders are net-long suggests Gold prices may continue to fall. Traders are further net-long than yesterday & last week, and the combination of current positioning and recent changes gives us a stronger Gold-bearish contrarian trading bias from a sentiment standpoint.
See how shifts in Gold retail positioning are impacting trend- Learn more about sentiment!
---
Active Trade Setups
- EUR/USD Technical Price Outlook: Euro Testing Lower Bounds of Support
- USD/CAD Price Outlook: Rally Stalls at Critical Resistance Zone
- Written by Michael Boutros, Currency Strategist with DailyFX
Follow Michael on Twitter @MBForex


