


Equity Analysis and News
- S&P 500 | Descending Trendline to Spark Inflection Point
- DAX | Key Resistance Cleared, Bulls Target 11500
S&P 500 | Descending Trendline to Spark Inflection Point
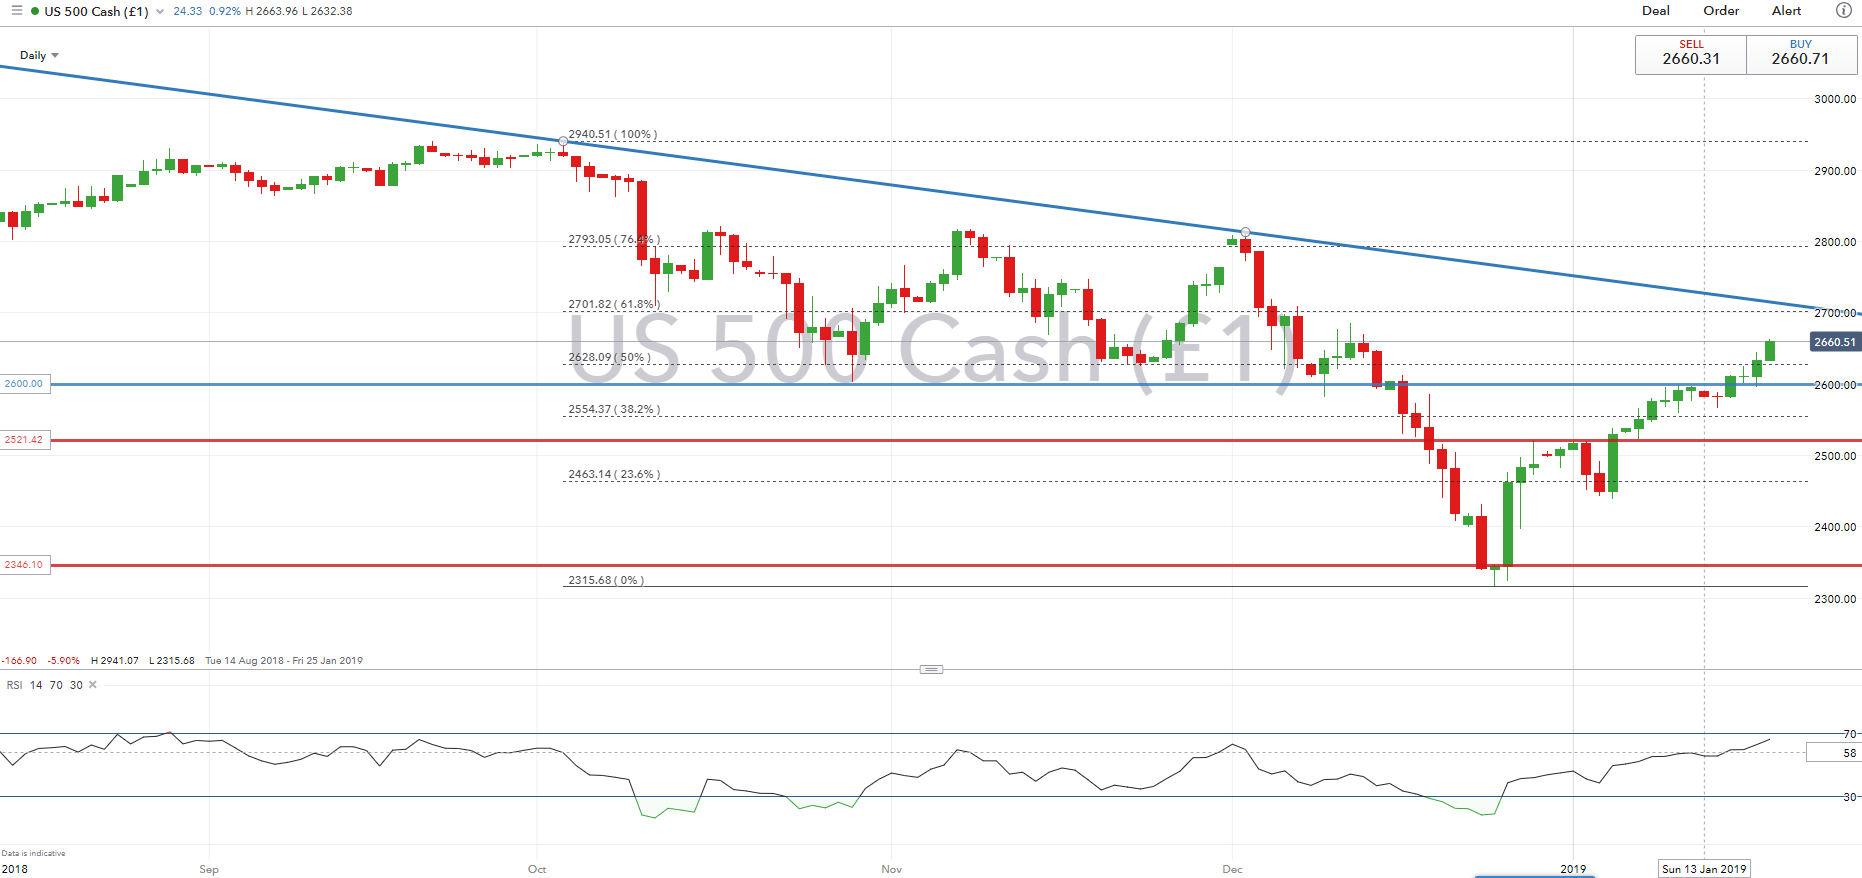
Following the closing break above 2600, the S&P 500 has continued to push for better levels. However, momentum to the upside could possibly be curbed by notable resistance at the 2700 level, which also coincides with the 61.8% Fibonacci retracement. Alongside this, the descending trendline from the record high sits at 2710-20, which could allow for a potential topping out for the index.
S&P 500 Price Chart: Daily Time Frame (Sep 2018 – Jan 2019)
DAX | Key Resistance Cleared, Bulls Target 11500
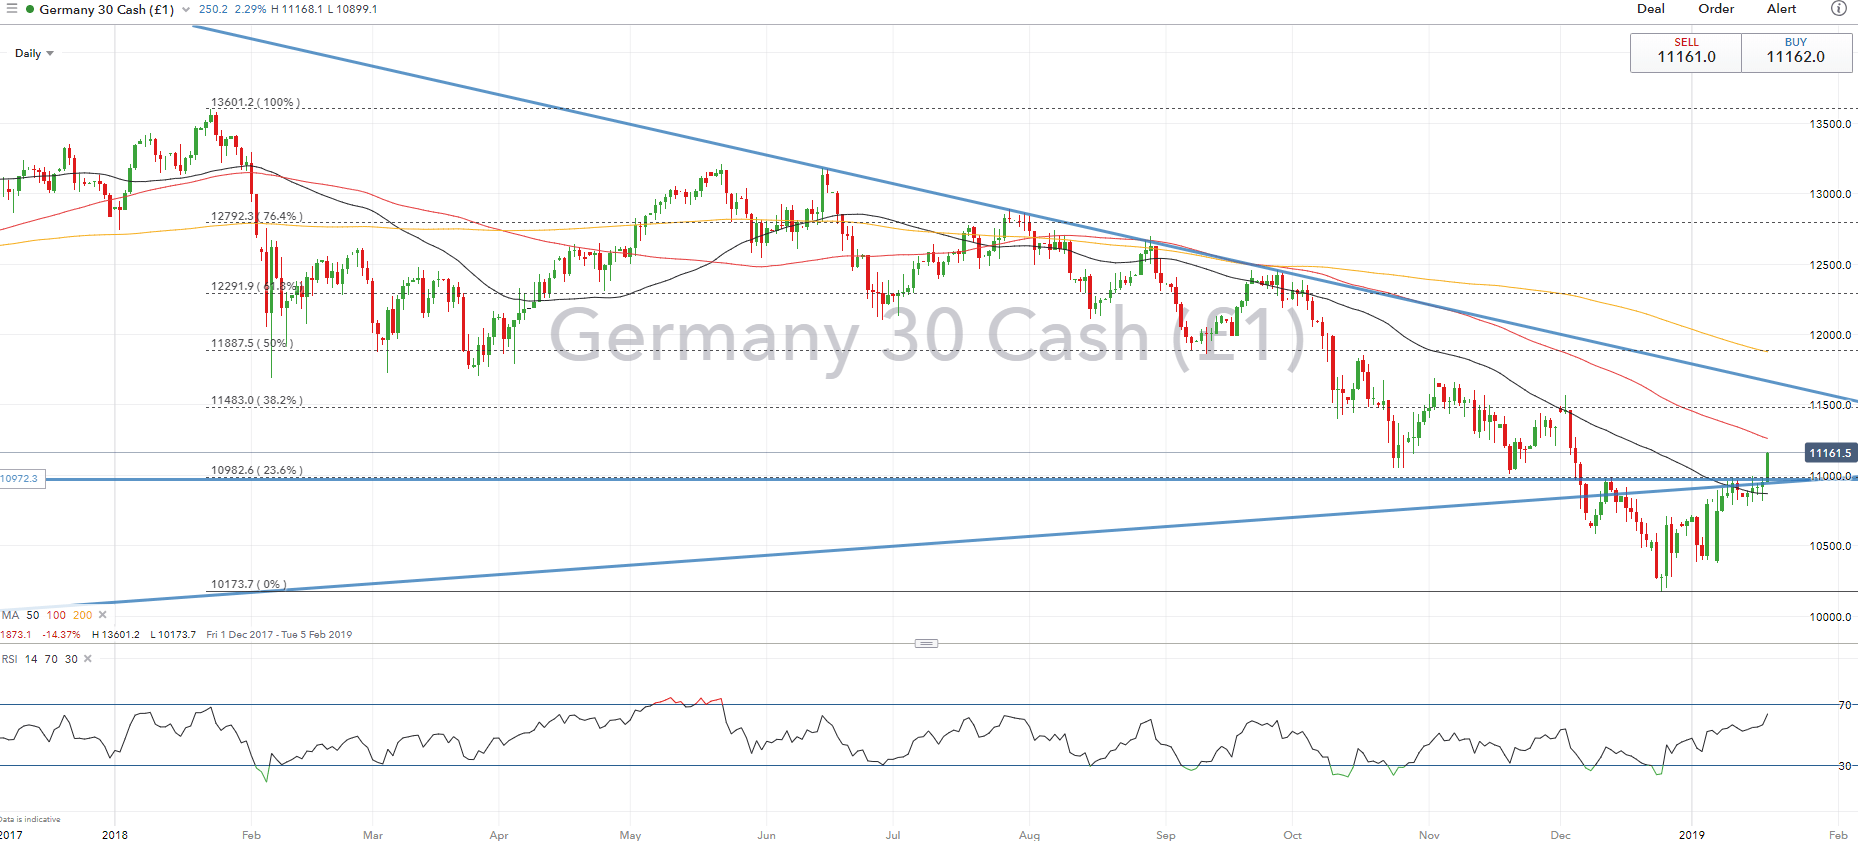
As noted last week, the DAX had reached the first big level of resistance, which has subsequently been broken. As such, eyes are on a move towards the 100DMA (11250), which could offer the next level of resistance. A break above however, increases scope of a test of 11500, which roughly coincides with the 38.2% Fibonacci retracement of the 2018 peak to the 2018 low.
DAX Price Chart: Daily Time Frame (Dec 2017 – Jan 2019)
--- Written by Justin McQueen, Market Analyst
To contact Justin, email him at Justin.mcqueen@ig.com
Follow Justin on Twitter @JMcQueenFX
Other Weekly Technical Forecasts:
Australian Dollar Forecast: AUD/USD, AUD/CAD Prepare for Next Big Moves as AUD/JPY May Reverse


