


GBPUSD and EURGBP Technical Analysis
We have recently released our Q1 Trading Forecasts for a wide range of Currencies and Commodities, including GBPUSD with our fundamental and medium-term term technical outlook.
Last Week’s Sterling (GBP) Technical Outlook: GBPUSD, EURGBP and GBPNZD
GBPUSD Long-Term Moving Average Resistance
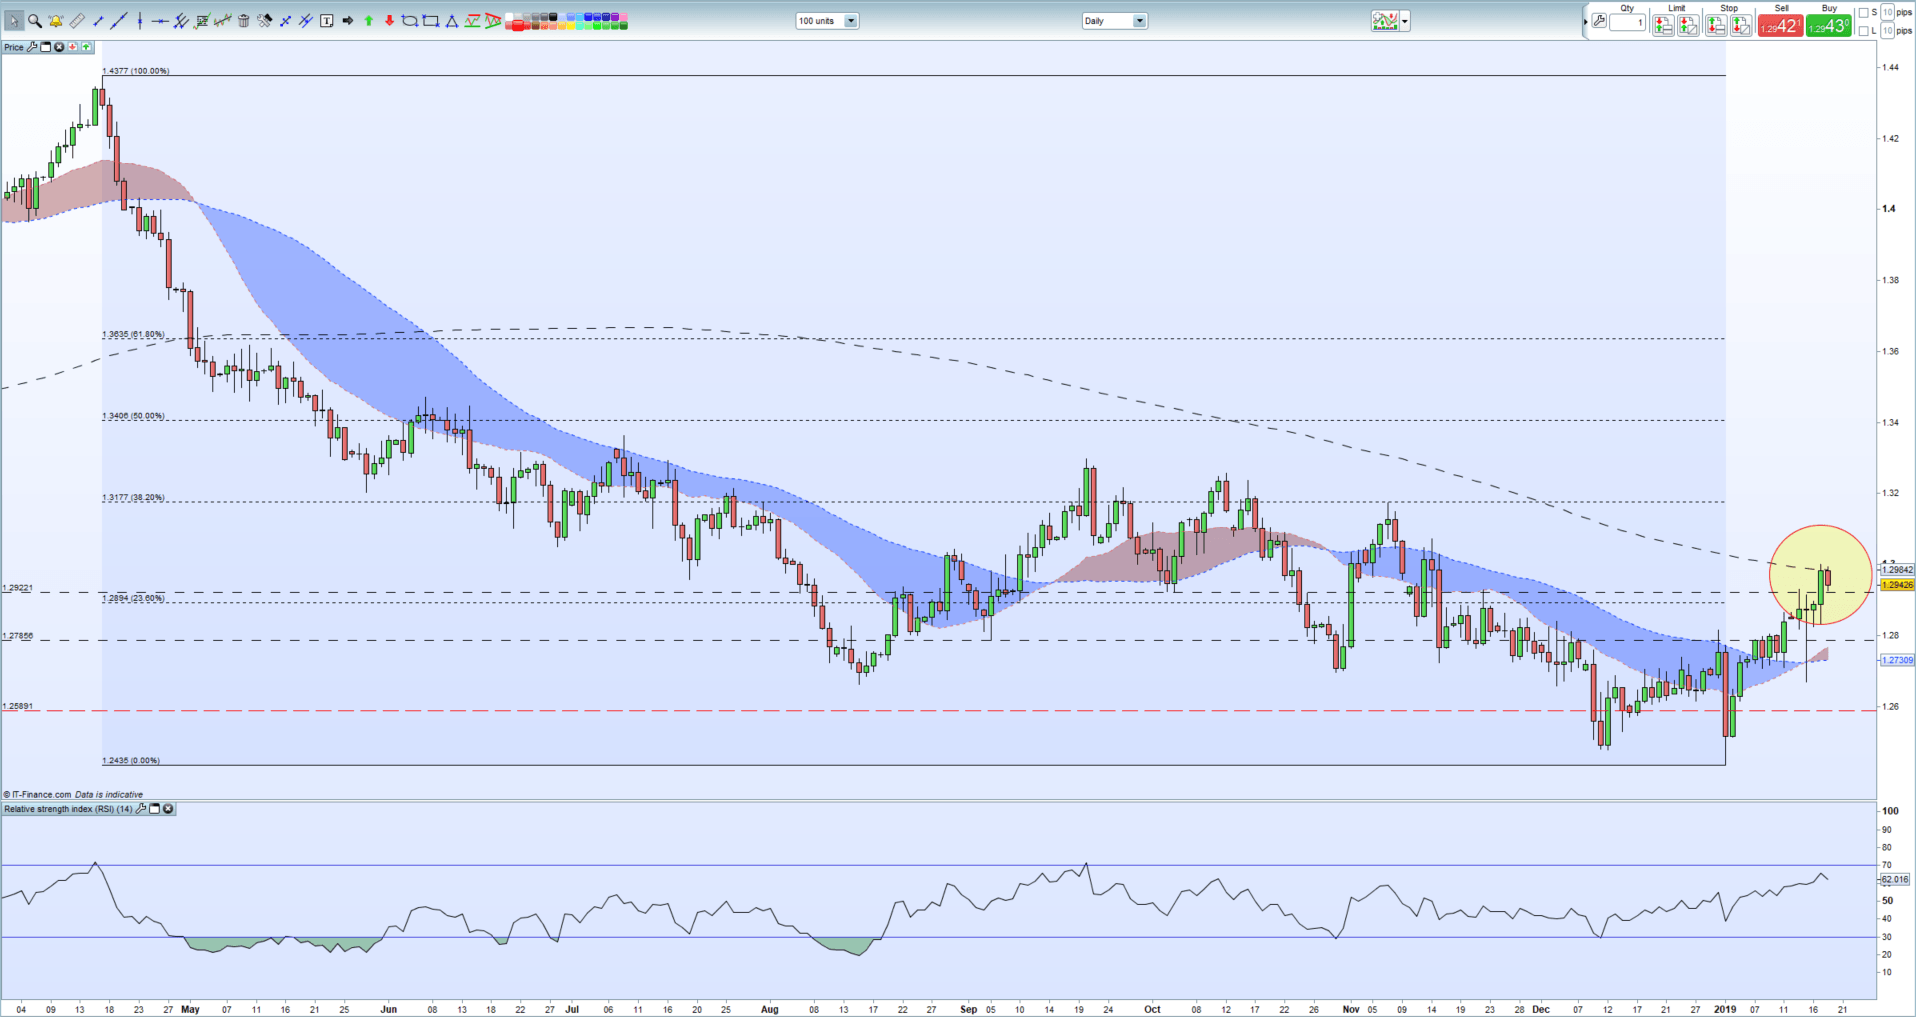
GBPUSD has enjoyed a strong run in 2019, picking itself up from a 1.2435 low to touch the 1.3000 level on an improving fundamental backdrop. This year’s mini-rally now sees GBPUSD touching the 200-day moving average and Cable has failed at its first attempt to break and close above here. Another attempt is expected shortly and if successful, the 38.2% Fibonacci retracement level at 1.3177 becomes the next target. This level also coincides with the November 7 high. If this level is closed above, the recent series of lower highs will be broken, adding an additional bullish nudge for the pair. GBPUSD have also made four higher lows in a row, so if 1.2832 – Thursday’s low - remains intact, the chart set-up for GBPUSD remains constructive.
GBPUSD Daily Price Chart (April 2018 - January 18, 2019)
EURGBP Rebound Away From Oversold Territory
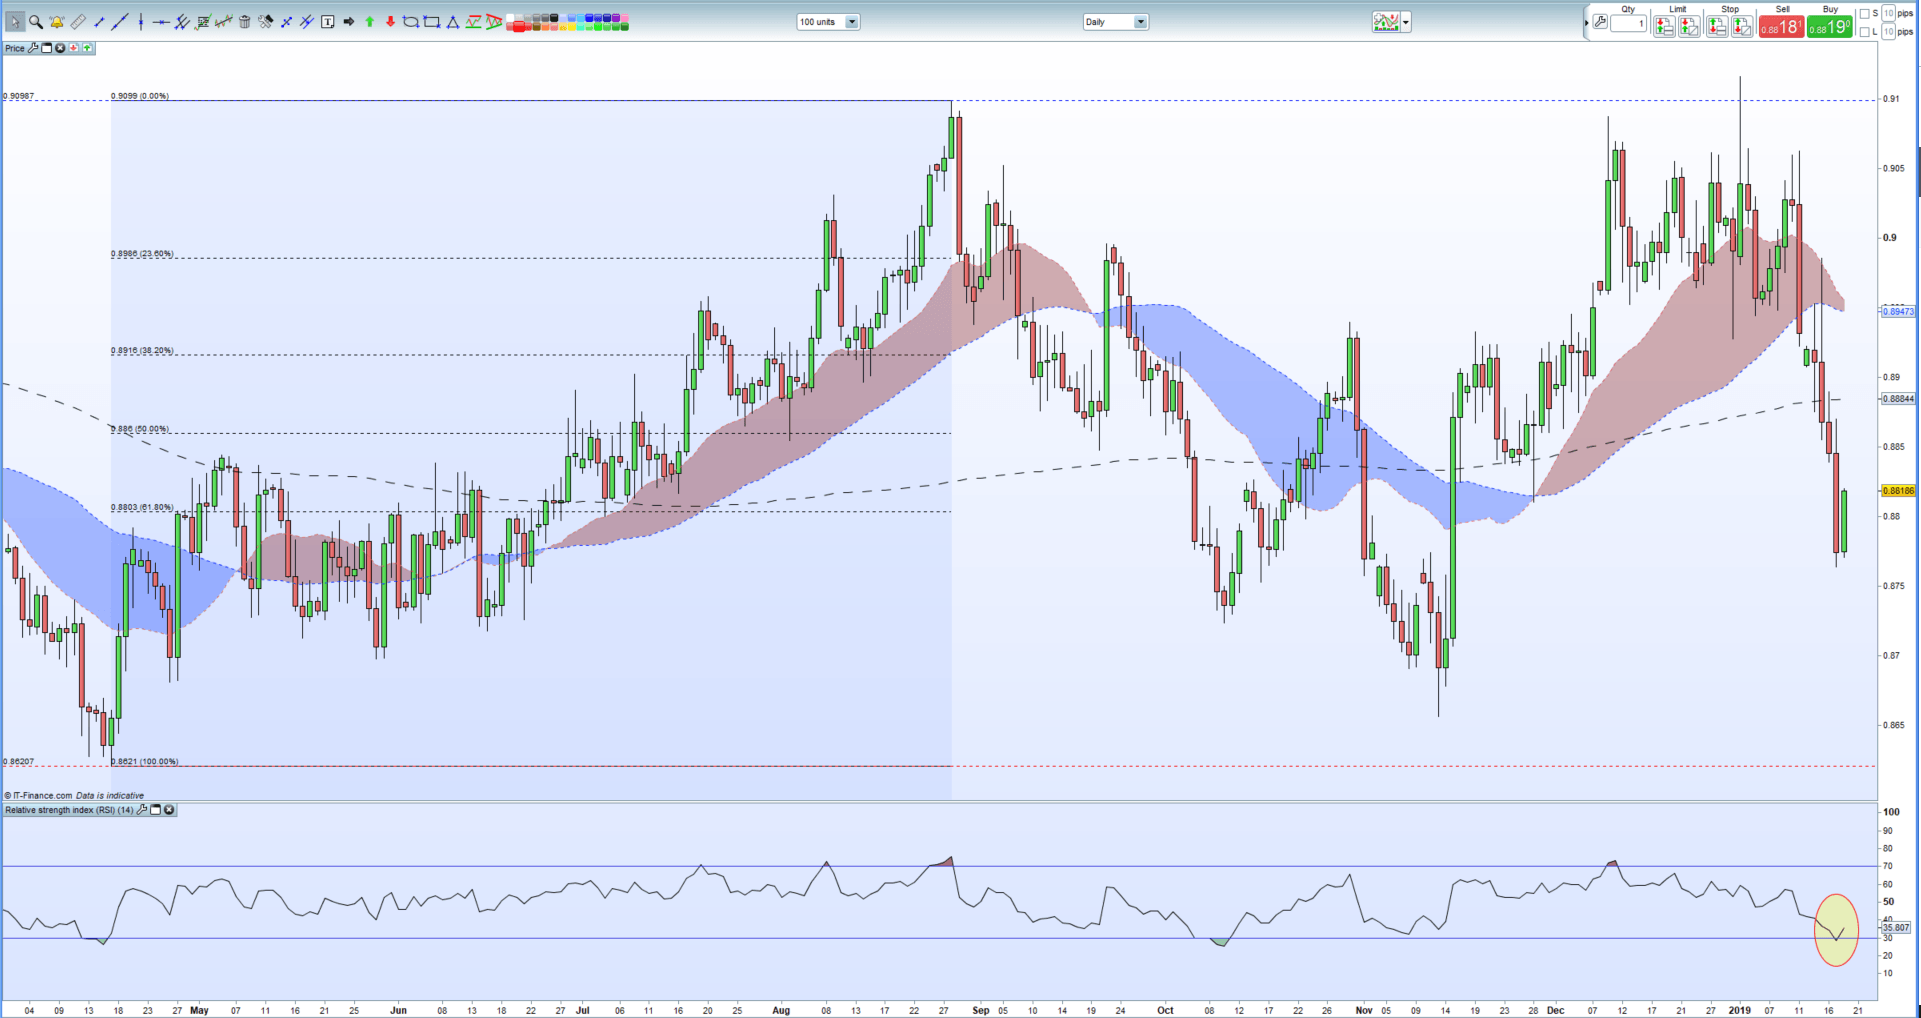
EURGBP is pulling back from its recent two-month low print of 0.8762 and is back above 0.8800 as the RSI indicator shows the pair to be oversold in the short-term. Any further rally will meet resistance at 0.8860 – the 50% Fibonacci retracement – just ahead of the 200-day moving average at 0.8884. These levels may prove difficult to break if the fundamental background remains the same, leaving EURGBP vulnerable to a further downturn. Horizontal support at 0.8723 before a re-test of the November 13 low at 0.8655.
EURGBP Daily Price Chart (April 2018 – January 18, 2019)
DailyFX has a vast amount of resources to help traders make more informed decisions. These include a fully updated Economic Calendar, and a raft of constantly updated Educational and Trading Guides
--- Written by Nick Cawley, Analyst
To contact Nick, email him at nicholas.cawley@ig.com
Follow Nick on Twitter @nickcawley1
Other Weekly Technical Forecasts:
Australian Dollar Forecast: AUD/USD, AUD/CAD Prepare for Next Big Moves as AUD/JPY May Reverse


