


Bitcoin (BTC), Ethereum (ETH), Litecoin (LTC) Price Forecast, Analysis and Chart:
- Bitcoin battles with $9,000 level.
- Cryptocurrencies rally across the board.
If you are interested in trading the cryptocurrency market, we have produced a Day Trading Guide to Bitcoin and Other Cryptocurrencies to help you better understand this highly volatile asset class.
Cryptocurrency Rally Continues
The two-month cryptocurrency rally continues Friday with all major coins/tokens in positive territory. Market leader Bitcoin has just touched the $9,000 level and made its highest level since November 11, while Ethereum is back at levels last seen two months ago.

Coinmarket.Cap
We have produced a series of cryptocurrency reports recently, highlighting notable technical set-ups and important price points.
Ripple, Ethereum Face Key Technical Levels – XRP/USD and ETH/USD Price Outlook
Litecoin (LTC) Price Analysis: Bullish Breakout or Fake Break?
Bitcoin Chart Exposes Key Reversal Signals – BTC/USD Price Forecast
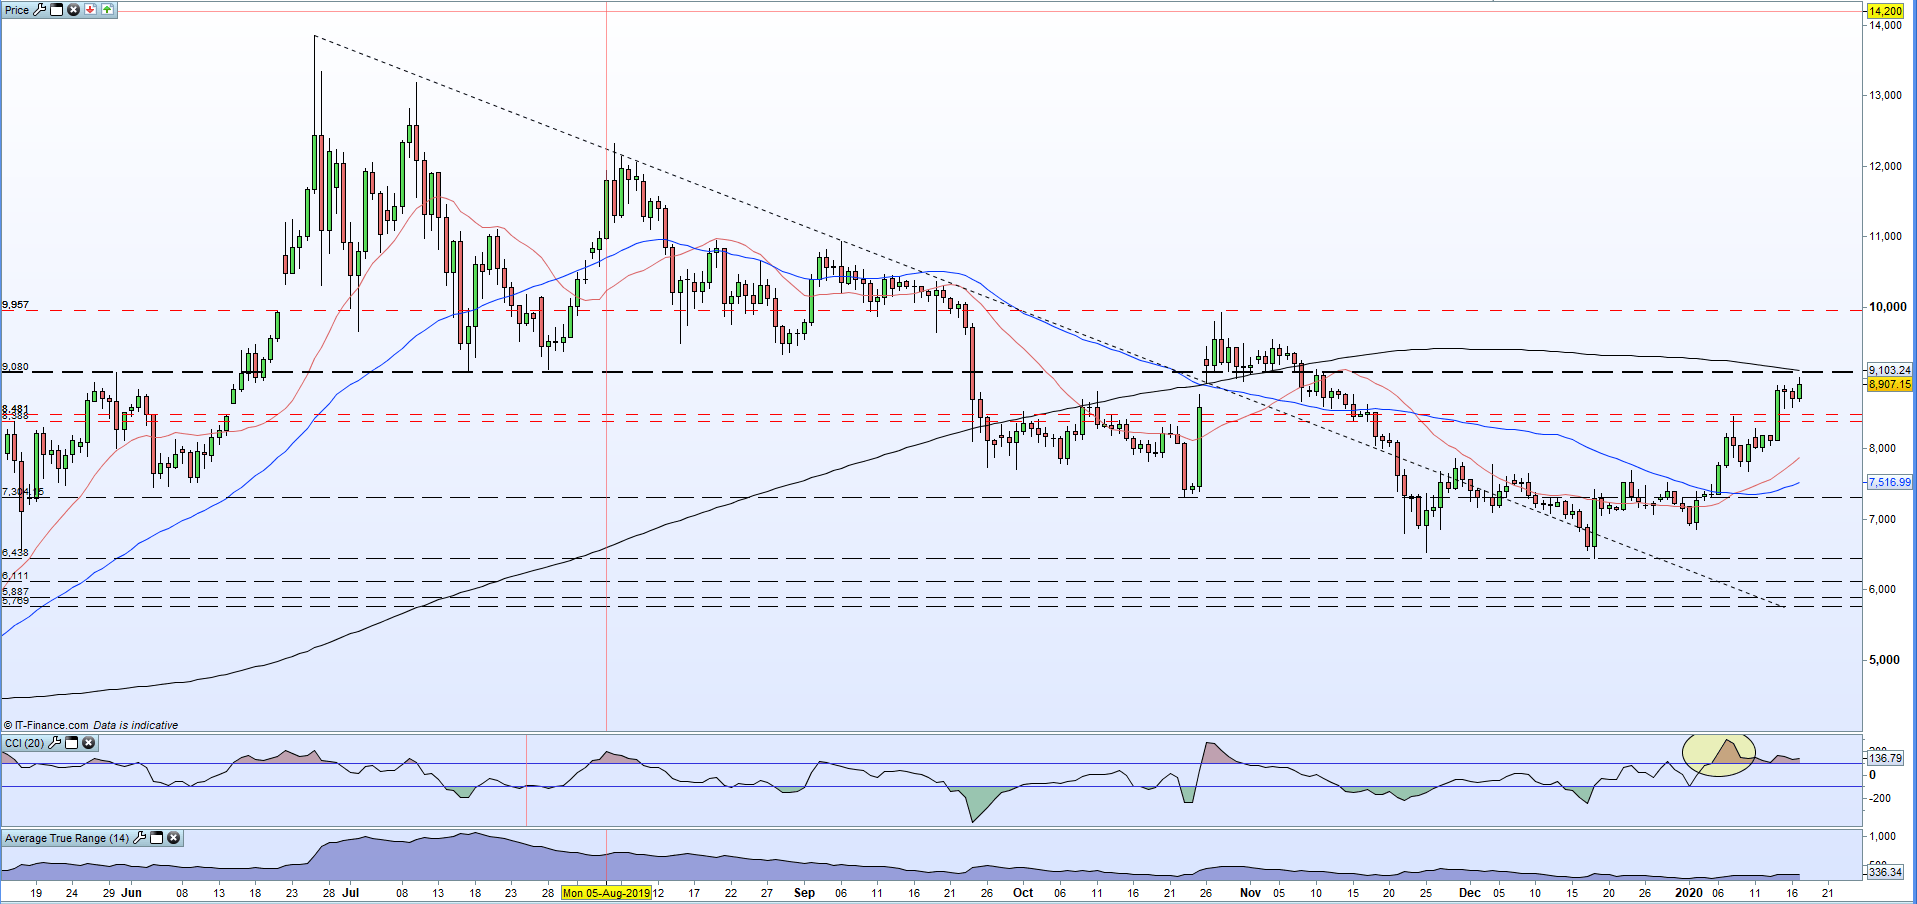
Bitcoin’s latest run, while fueling bullish sentiment, needs to break a couple of important technical levels to turn the chart further positive. A break of the 200-day moving average, currently around $9,100, would confirm short-, medium- and long-term positive sentiment, while a close above $9,930 would break a series of lower highs and add further bullish sentiment. Initial support either side of $8,500.
As always with this sector, sharp moves either way can occur in a short timeframe, and with the market trading 24/7, care should be taken over the weekend.

Bitcoin (BTC) Daily Price Chart (May 2019 - January 17, 2020)
Traders may be interested in two of our trading guides – Traits of Successful Traders and Top Trading Lessons – while technical analysts are likely to be interested in our latest Elliott Wave Guide.
What is your view on the latest cryptocurrency rally? You can let us know via the form at the end of this piece or you can contact the author at nicholas.cawley@ig.com or via Twitter @nickcawley1.


