


Litecoin (LTC) Price Forecast, Analysis and Chart:
- Litecoin turns 70% higher in a month.
- Daily chart still suggests that the longer-term trend is valid, for now.
If you are interested in trading the cryptocurrency market, we have produced a Day Trading Guide to Bitcoin and Other Cryptocurrencies to help you better understand this highly volatile asset class.
Litecoin (LTC) Surges But is This Rally for Real?
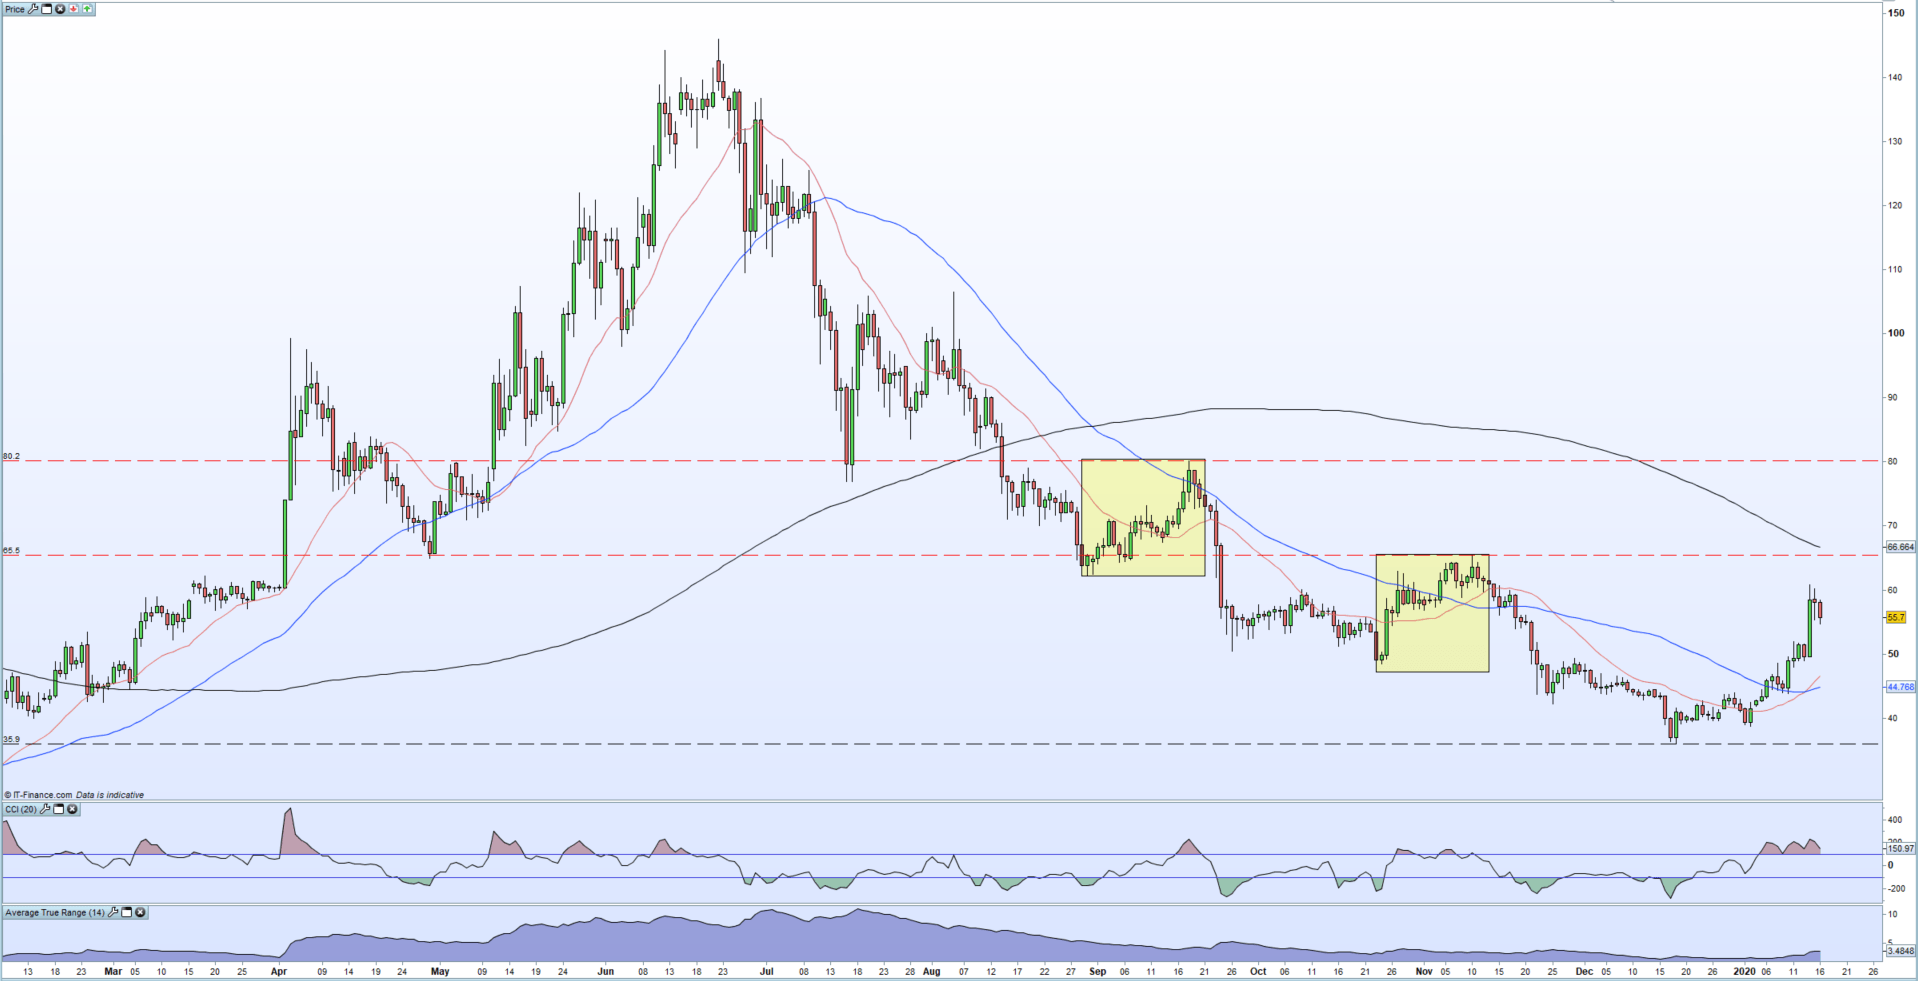
Litecoin (LTC) has put in an impressive 70% rally since the its December 18 low at $35.9 and Tuesday’s $61.0 high, marking it out as one of the top performing cryptocurrencies over the last month. While the move suggests that buyers are back in control and higher prices likely, the same pattern of rally and then sell-off has been seen twice on the daily chart in recent months, positing the question is this latest rally sustainable?
The daily chart shows a mixture of positive and negative signs, but a clearer picture and a confirmation of longer-term direction is starting to appear. Since its June 2019 high, Litecoin has made an unbroken series of lower highs, while a series of lower lows remain for now. Litecoin has made a clear break above the 20- and 50-day moving averages, while the shorter-dated ma has also turned higher through the medium-dated ma. This move was also seen in early November before the rally fizzled out and the 20-dma turned lower. The recent move has also pushed LTC into overbought territory – using the CCI indicator – for the first time in two months.
Buy the Higher Low and Sell the Lower High
For the rally to gain further credibility, Litecoin needs to make a convincing break above $65.5, the last lower high, with further credence added if it can trade back above the 200-dma, currently at $66.6. This would then suggest that a re-test of the mid-December low is unlikely. A break below this low however, would continue the bearish sequence of lower lows.

Litecoin (LTC) Daily Price Chart (February 2019 - January 16, 2020)
Traders may be interested in two of our trading guides – Traits of Successful Traders and Top Trading Lessons – while technical analysts are likely to be interested in our latest Elliott Wave Guide.
What is your view on Litecoin (LTC) – bullish or bearish?? You can let us know via the form at the end of this piece or you can contact the author at nicholas.cawley@ig.com or via Twitter @nickcawley1.


