


Bitcoin Price Technical Outlook
Check out our Q1 USD forecasts . Download for free main currencies and commodities trading guides.
BTC/USD Price – Multi- Week High
Last week, Bitcoin rallied to $8.462 -its highest level in over seven weeks. Later, the weekly candlestick closed in the green with a 10.8% gain. Today, Bitcoin resumed bullish price action and printed $8.740- its highest level in nearly two months.
Alongside this, the Relative Strength Index (RSI) rose from 57 to 68 emphasizing that buyers were in control.
Just getting started? See our Beginners’ Guide for FX traders
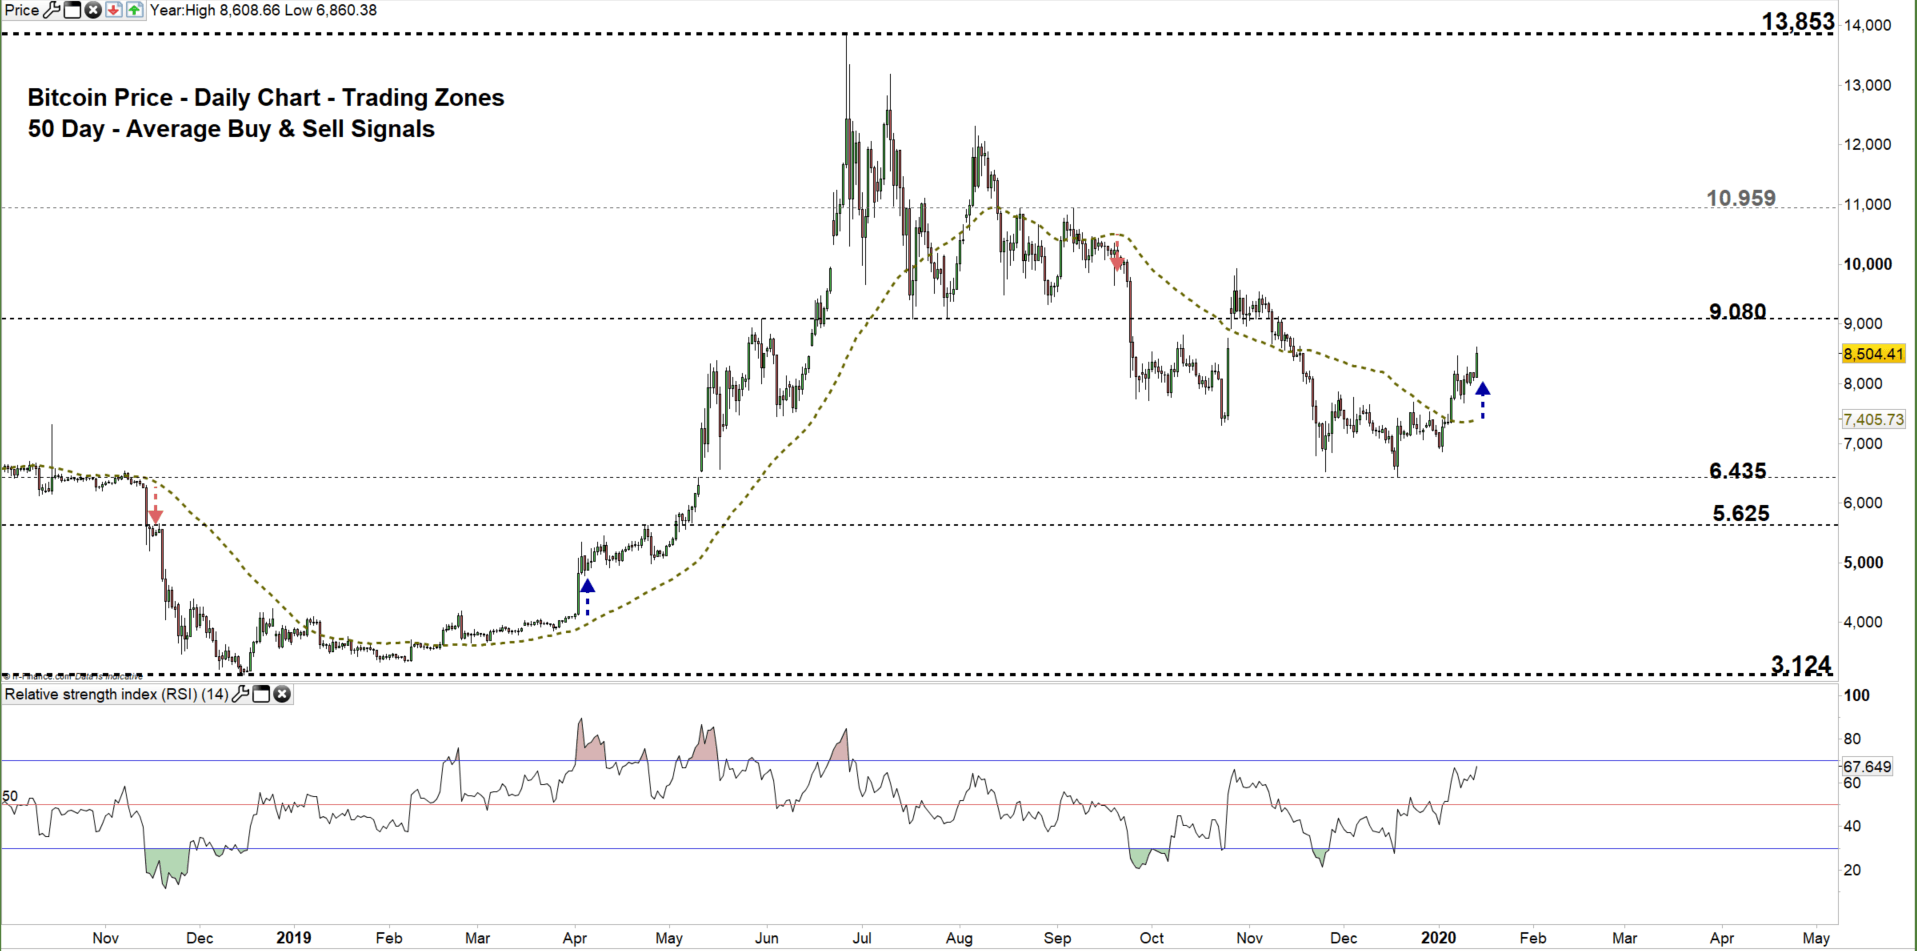
Bitcoin PRICE DAILY CHART (OCt 2, 2018 – Jan 14, 2020) Zoomed Out
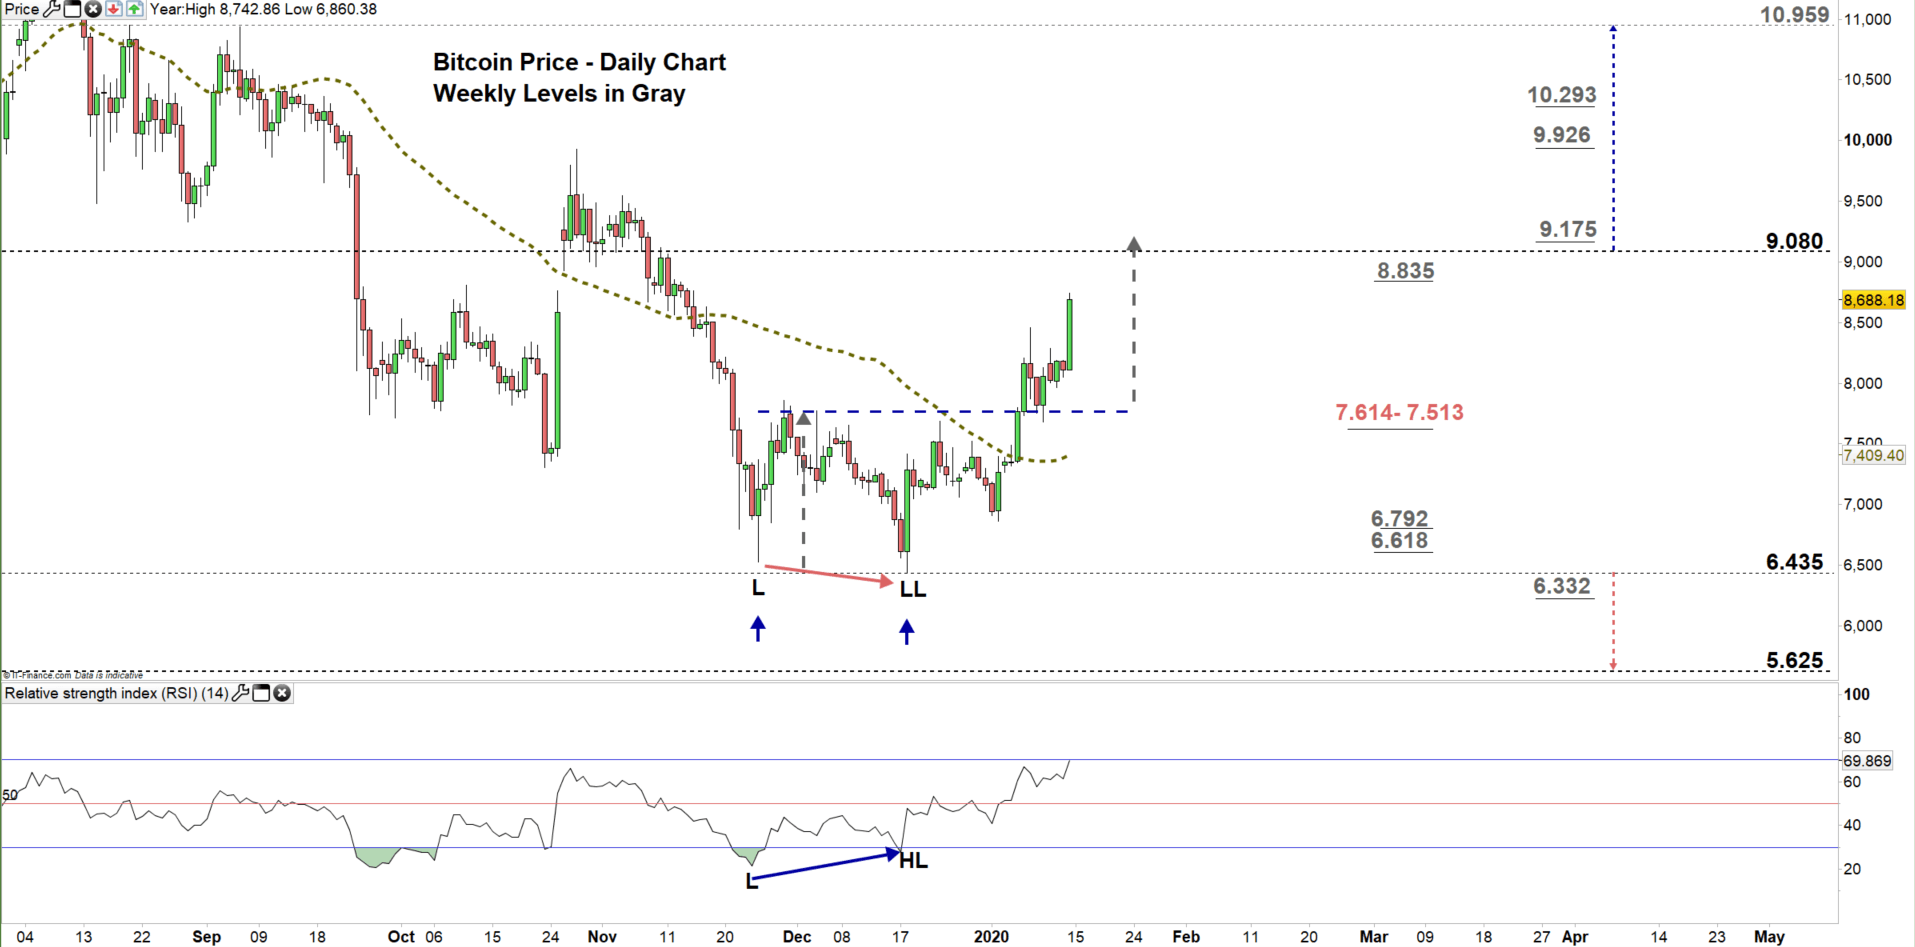
Bitcoin PRICE DAILY CHART (SEP 6 – Jan 14, 2020) Zoomed In
From the daily chart, we notice on Dec 18 BTC/USD rebounded from the low end of current trading zone $6.435 - $9.080 reflecting seller’s hesitation at this stage. Since then, sellers have pulled back and this generated some reversal/bullish signals.
A bullish divergence between the price and RSI as the price created a low with a lower low meanwhile the oscillator created low with a higher low. On Jan 6, Bitcoin closed above the 50-Day average producing another bullish signal. On Friday, the price rallied above the neckline of double bottom pattern located at $7.765 eyeing a test of $9.000 handle.
A close above the high end of the zone, opens the door for buyers to take the lead and push BTC/USD towards $10.959. Nevertheless, the weekly resistance levels underlined on the chart (zoomed in ) should be considered as some traders could exit/ join the market at these points.
On the other hand, any failure in closing below the high end may reveres the price’s direction towards the low end of the zone. Although, the daily and weekly support levels and area marked on the chart should be monitored.

Bitcoin PRICE FOUR Hour CHART (DEC 21 – Jan 14, 2020)

Looking at the four-hour chart, we notice on Jan 7 Bitcoin started uptrend move creating higher highs with higher lows. On Sunday, this move paused as BTC/USD carved out a lower high at $8.286.
Today, the crypto currency resumed bullish price action eyeing a test of the high end of the trading zone discussed on the daily chart. A break above $9.175 may push the price towards $9.545 contingent on clearing $9.378 before. On the other hand, a break below $8.099 could send Bitcoin towards $7.940. Although, the daily support level underlined on the chart should be kept in focus.
See the chart to know more about the critical levels in a further bearish/ bullish move.
Written By: Mahmoud Alkudsi
Please feel free to contact me on Twitter: @Malkudsi


