


US Dollar Talking Points:
- The US Dollar breakout failed at 113.92 on Friday morning – the same spot that held the highs the morning after CPI was released earlier this month. That sets up a possible double top formation.
- Despite a seemingly supportive backdrop for a stronger USD (and weaker stocks) this month, those themes seem to be getting priced-out to a degree, suggesting that there may be pullback potential, near-term.
- Key for the USD this week is EUR/USD as the European Central Bank hosts a rate decision on Thursday and the pair is putting in some price action behavior that can lead into a deeper pullback. I got into that and the situation around USD/JPY and the BoJ’s intervention below.
- The analysis contained in article relies on price action and chart formations. To learn more about price action or chart patterns, check out our DailyFX Education section.

Is the US Dollar in a position for a deeper pullback?
To be sure, the headlines remain dizzying and in many cases, dire. This weekend introduced some additional risk from China and Chinese markets have been on their back foot, as-is, but this Monday is seeing even more pain with the Nasdaq’s ‘Golden Dragon’ index down more than 15% from Friday’s close. And at one point this morning that number was as high as 21% and this is for a market that’s already been persistently punched so far in 2022 trade. And bigger picture, that index is more than 79% off of the 2021 swing-high, making for a dramatic move in a relatively short period of time.
But, logically speaking, this additional pain being priced-in China should have some impact to US markets but so far this morning, little is showing.
Perhaps more telling, however, is how markets have reacted since the CPI print on October 13th. There was a flurry of activity after that release but reversals soon popped up. The DXY tagged 113.92 as a high before backing down – and the S&P 500 found support just above the 3500 level.
Last week saw another failed test at 113.92, this time on Friday morning. A batch of drivers appeared around the same time, with an early-morning Wall Street Journal article from one of the most popular Fed watchers in finance. Nick Timiraos was in the headlines back in June (discussed in this article), warning markets of a 75 bp hike a couple of days before the rate decision. Given that the Fed was in a blackout and by rule, was supposed to refrain from issuing market commentary, this report was extremely interesting.
And it’s perhaps no coincidence that when the actual rate hike was announced, markets didn’t freak out. The S&P actually gained on that FOMC rate decision – and then bottomed a couple of days later before rallying for the next two months.
The more recent report, issued on Friday, did not say that there was a pivot incoming. It did, however, begin to soften what’s been a harsh tone from the Fed, illustrating that the next rate decision is when the bank will discuss how to begin slowing rate hikes. And while this isn’t evidence of a pivot is a change that may remove some pressure from the matter.
That report hit around the same time some comments from Mary Daly of the San Francisco Fed began to make their way around. She’s been one of the more notable Fed-speakers, in my opinion, as she helped to bring rates back to life in early-August when reminding markets that, despite the June FOMC rate decision, the Fed was nowhere near done with rate hikes.
Her remarks on Friday were notably softer than her prior comments, instead focusing on the risk of over-tightening. And when those comments hit the wires after the earlier report from the Wall Street Journal, the risk trade was ready for some run as both USD dropped and stocks ran-higher. This was also around the time of BoJ intervention, so there was quite a bit going on just ahead of the Fed’s entrance into the blackout window ahead of the November FOMC. The S&P 500 finished Friday with a bullish engulfing candlestick, which keeps the door open to further gains.
In the USD – the high on Friday printed at the same level that produced the high on October 13th – the level of 113.92. That makes for a double top formation, with a neckline at that same support that I used for the USD last week, plotted around 111.73. This was also resistance from the week before that in an ascending triangle formation that led to a bullish breakout in the USD.
US Dollar Four-Hour Price Chart

Chart prepared by James Stanley; USD, DXY on Tradingview
USD Shorter-Term
Double top formations are bearish setups, but they don’t trigger until the neckline of the formation is taken-out. Until then, it’s simply a matched high at a point of resistance. The low between the two highs is what we can call the neckline – and once that breaks – the door opens to bearish breakout potential.
Traders can even take this a step further by getting some rough estimate for how long the move might run. By taking the distance from the top to the neck – and then subtracting that amount from the neckline – we can get a general idea for where support may show up if the formation is going to fill-in and continue.
Personally, I look at the projection as a possibility. The more important part is the breakout itself, at which point I can generate levels from other means, namely prior price action. In this case, for the USD, given the distance of 2.15 from the 113.92 high down to the 111.77 low (neckline), this would highlight potential down to 109.62. And that would take-out a few spots of support along the way but, notably, prices would remain well-above the September swing-low.
So, its possible that the double top fills in, runs down to that level, and the bigger picture behind the USD remains as bullish. But, that’s neither here nor there for now, as prices in USD have just begun to work below the neckline of that formation.
This week’s open produced a quick move below that support, helped along by what appears to be more BoJ intervention which was a net short-USD, long-JPY type of deal. The DXY pulled back, but then found resistance at prior support around 112.58, and bears have pushed right back towards the neckline.
This keeps the door open for a deeper pullback in the longer-term bullish trend. For next supports, I’m tracking prior price action swings at 111.45 and then 110.78, after which the 110-110.23 zone comes back into play and that’s where the current home of the October low is.
US Dollar Two-Hour Price Chart

Chart prepared by James Stanley; USD, DXY on Tradingview
EUR/USD
If the US Dollar is going to put in a deeper pullback – it’ll likely need some help from the Euro. And, as it turns out, this week brings a highly-important event for the Euro with Thursday’s ECB rate decision. The bank is expected to continue getting more-hawkish in the effort of stemming inflation.
From longer-term charts, however, that shift doesn’t appear to be gaining much traction as EUR/USD remains in the midst of an aggressive sell-off, which started in May of last year but since February of 2022 has taken-on a significantly more one-sided nature.
EUR/USD Weekly Price Chart

Chart prepared by James Stanley; EURUSD on Tradingview
EUR/USD first broke back-below parity in July of this year. I didn’t expect that to change the trend in EUR/USD but I did expect that it’d slow the sell-off. And it did to a degree, but sellers came right back in late-August and a build of lower-highs eventually led to a stark sell-off towards the end of Q3.
At the time, there was pretty considerable fear around European energy supplies throughout the winter. And inflation in Europe was already at exorbitant levels – a falling Euro simply made that a larger threat. Which is probably one of the reasons we’ve heard such a change in tune from the ECB of late.
The question now is whether that aggressively-bearish trend is ready for a pullback. Prices are back to re-testing the .9900 level, which is confluent with a bearish trendline. The trendline itself has been messy so I’m looking to it as more of a guide as opposed to a move slope of resistance. But – with buyers forcing a series of higher-lows since the late-September low, it appears that the door is opening for a deeper bullish move. If bulls can punch through .9900, .9950 is sitting overhead after which the parity level comes back into play.
And a push above parity could lead to a short-squeeze scenario, particularly if it’s backed by representative policy at this Thursday’s ECB rate decision.
With that said, this is the ECB that we’re talking about, which has a history of letting markets down, so it’s probably best to keep expectations light.

EUR/USD Daily Chart
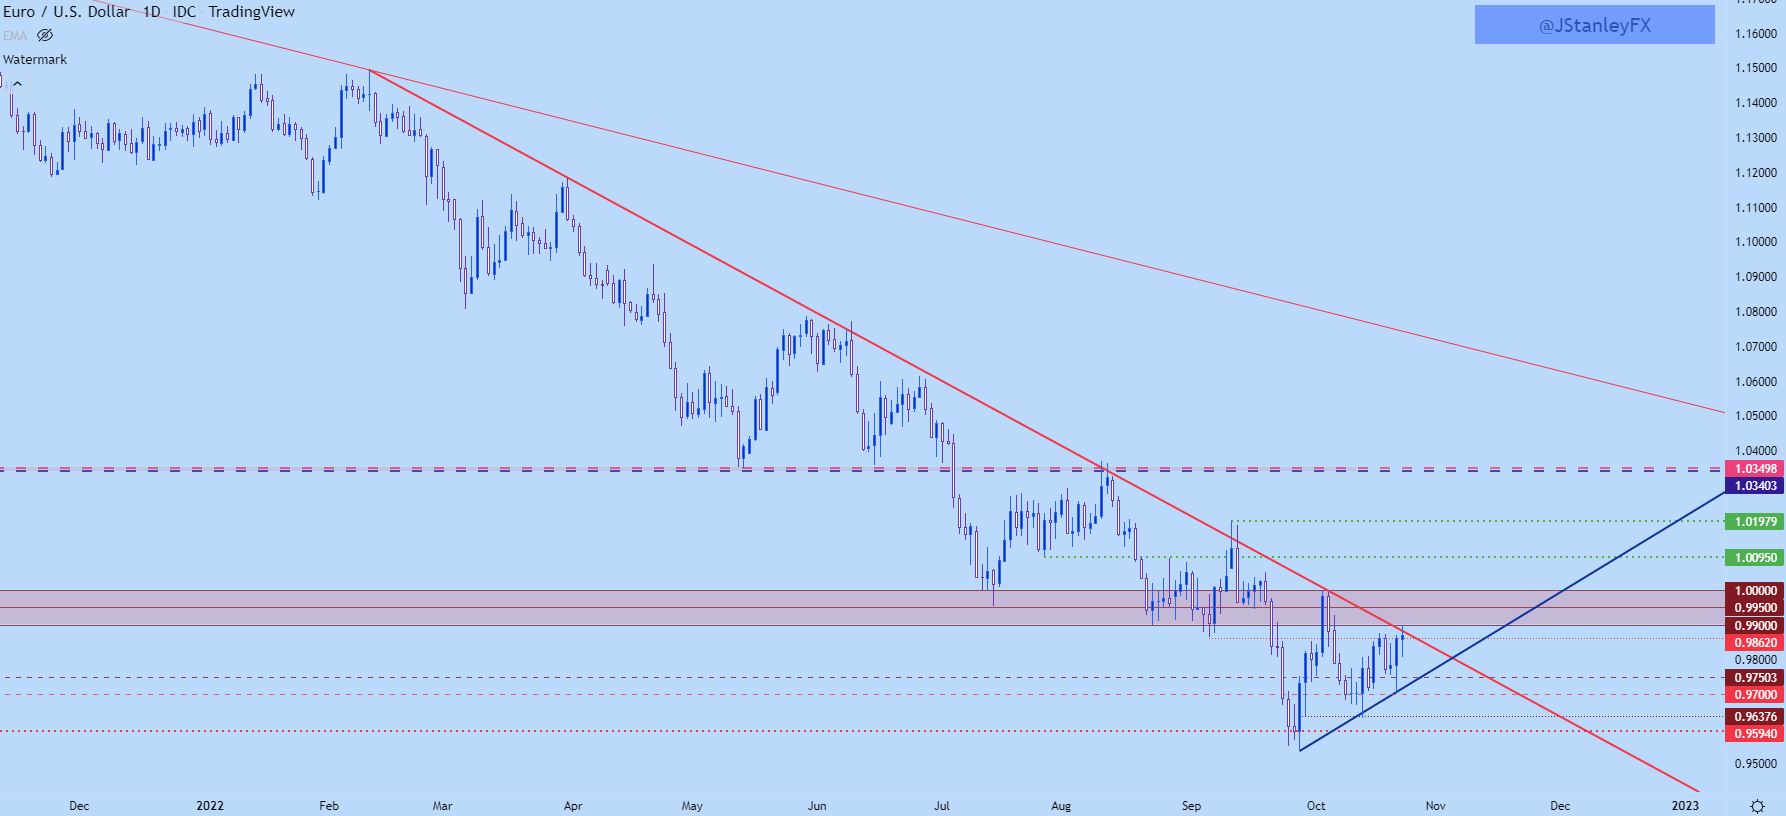
Chart prepared by James Stanley; EURUSD on Tradingview
GBP/USD
Short-term charts of GBP/USD look to be an absolute mess to me. As such I don’t have much from a near-term basis that’s of interest at this point.
The daily chart could be a bit more interesting, however, largely from the basis of volatility compression. Prices continue to work deeper in a symmetrical triangle so, both lower-highs and higher-lows since the collapse-like move in late-September.
This can also offer some boundaries for when setups may become attractive again. For resistance, I’m still tracking that around the same 1.1500 area. For support, there’s two possible spots depending on how aggressive one wants to be with bearish GBP/USD themes. Either last week’s low of 1.1061 or the bigger picture support around 1.1000 could be used to indicate a greater push from bears.

GBP/USD Daily Price Chart
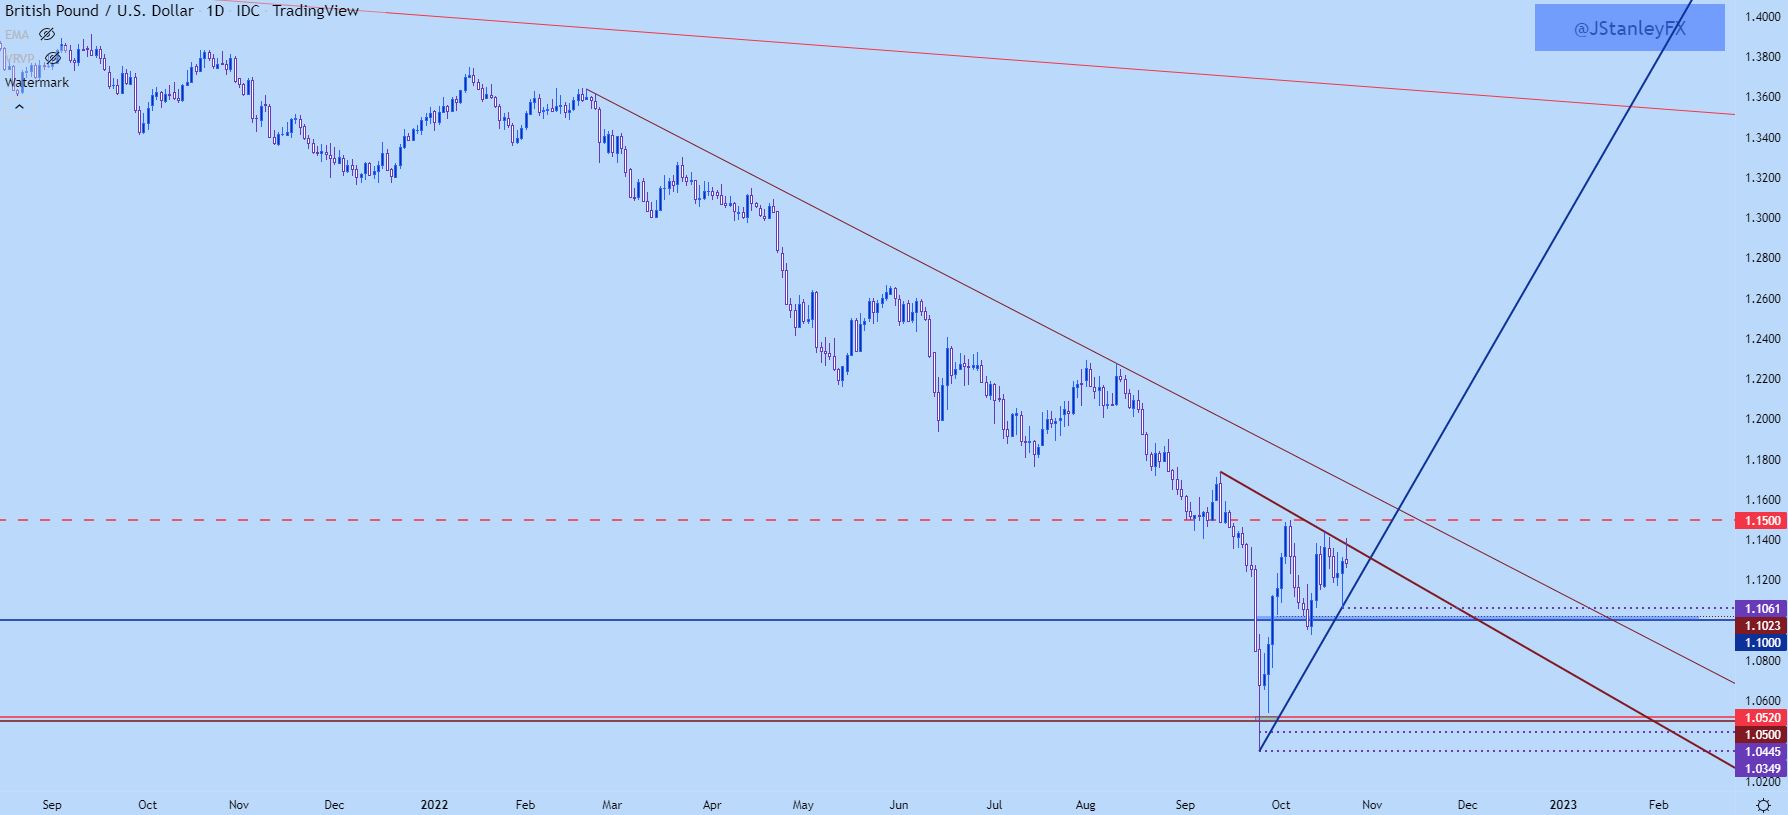
Chart prepared by James Stanley; GBPUSD on Tradingview
USD/CAD
USD/CAD put in a visceral response to resistance late last week, which resides in the 1.3833-1.3850 area. That led to a push down to a lower-low, which extended after this week’s open. Prices are posing a pullback into the prior range and this keeps the door open for a lower-high to lead-in to another lower-low.
My quandary at this point is one of divergence with DXY, particularly what I’ve seen so far through today’s US session. As DXY has pushed back towards key support in that 111.74 area, USD/CAD has continued to push-higher, indicating that we’re also seeing CAD-weakness along with that USD-weakness theme. This makes me question as to whether USD/CAD would be the best vehicle for plotting deeper USD-pullback scenarios.
With that said, the door appears open for short-term themes. The 1.3700 level is key, as this is confluent with the 38.2% Fibonacci retracement of the recent sell-off move. A break-below that opens the door for a move down towards 1.3652. But, alternatively, a hold of support there would be a higher-low on a short-term basis and that points to a possible re-test of the 1.3800 level, after which that longer-term resistance comes into play.
USD/CAD Four-Hour Price Chart

Chart prepared by James Stanley; USDCAD on Tradingview
USD/JPY
This is likely going to remain a liquid situation…
I wrote about the Yen in this week’s technical forecast, highlighting a continued bearish bias even despite the BoJ’s intervention last Friday. And the BoJ wasn’t done yet, as it appears that there was more of that intervention-activity earlier this morning.
But, as we’ve seen with prior instances, the BoJ has merely given traders opportunity for better entry points with those intervention runs. This has led to some pretty considerable derision on social media; and it does appear as though the BoJ is burning through finite FX reserves when it’s their very own monetary policy that’s encouraging the long side of USD/JPY trades. The carry is still decisively against the Yen and will likely remain the case as long as the bank sits on negative rates even as the rest of the world lifts interest rates.
And, if the intervention is a simple act of selling USD and buying JPY, well, that’s a counter-trend trade that’s gone up in smoke just hours after the strategy was deployed.
But – what if the BoJ simply wants to ward off long-term speculators here? Because for those looking to hold long USD/JPY on the basis of a carry trade, 400 pip swings are not a great thing. And this could begin to build motive for long-term carry setups to come into question, despite the still divergent policy outlays from the US and Japan. Effectively, this could be a somewhat-passive way of trying to set a floor on the Yen’s sell-off. Now as to whether it will work, that is another question.
Nonetheless, the carry remains positive and tilted to the long side of USD/JPY, so a pullback to support could quickly re-open the door for bullish setups. Patience is going to be needed, as those intervention moves can be fast and violent.
For support, I’m tracking a key zone from the 145 psychological level up to 145.90. If prices forces-below that, there’s another possible support around 143.50. And below that, there’s another big zone from 140 up to 140.80.
Which of those areas comes into play as support, at this point, seems to be based on just how aggressively the BoJ wants to address the matter and how much in FX reserves they’re willing to deploy.

USD/JPY Daily Price Chart
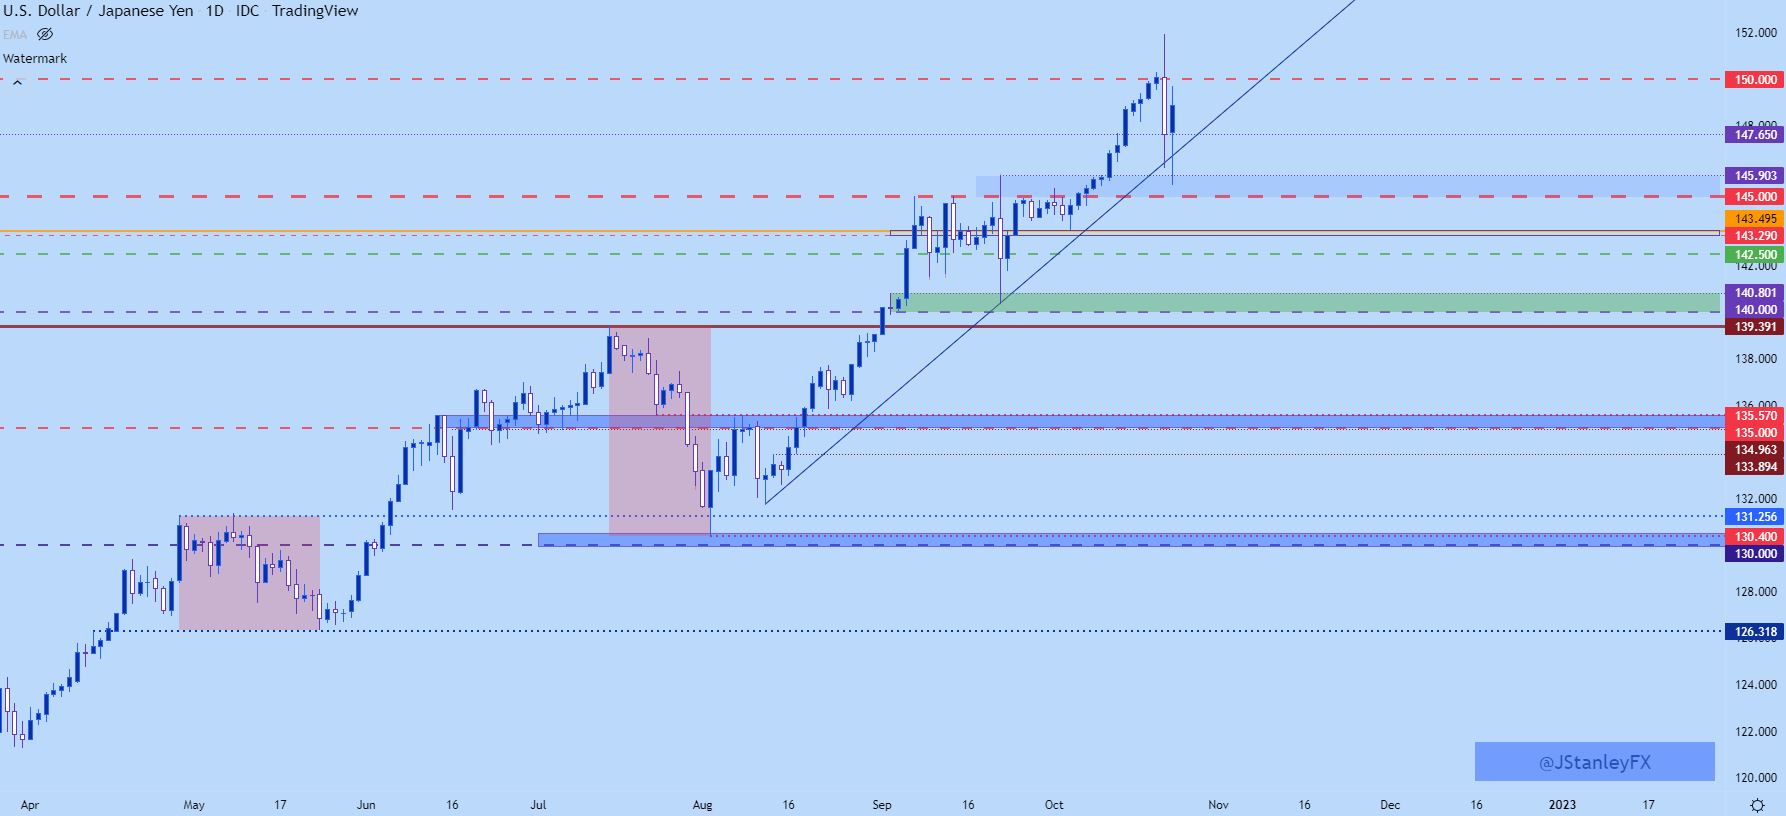
Chart prepared by James Stanley; USDJPY on Tradingview
--- Written by James Stanley, Senior Strategist, DailyFX.com & Head of DailyFX Education
Contact and follow James on Twitter: @JStanleyFX


