


S&P 500, Nasdaq Talking Points:
- Tomorrow brings the widely-awaited FOMC rate decision. The bank is now expected to hike rates by 75 basis points while warning of more hikes on the horizon.
- Perhaps the more important component of tomorrow’s event is the Summary of Economic Projections which will show the Fed’s thoughts on rates, inflation and growth in the coming months and years.
- Stocks have not taken the FOMC pivot in a very positive manner as evidenced by the -22% hit that’s shown in the S&P 500 so far this year to go along with the -33% hit in the Nasdaq from last November’s high.
- Caution is warranted for tomorrow but that should be obvious. With markets building in a heavy expectation for 75 bps of hikes, the Fed has some room to under-deliver which could potentially create motive for a counter-trend move.
- We’ve been discussing these themes at DailyFX throughout 2022 and a host of analysts have taken bearish stances on US equities as ‘Top Trades’ for Q2. To get the full Top Trades installment, the link below will allow for access.

Tomorrow brings the Fed and markets are on edge. In the past 24 hours we’ve seen odds of a 75 basis point rate hike surge up to 95%. And, notably, this all happened on the basis of a single report in the Wall Street Journal while the FOMC is in a blackout period – meaning that FOMC members are not supposed to be communicating about policy until tomorrow’s decision.
Rate Expectations for Tomorrow:
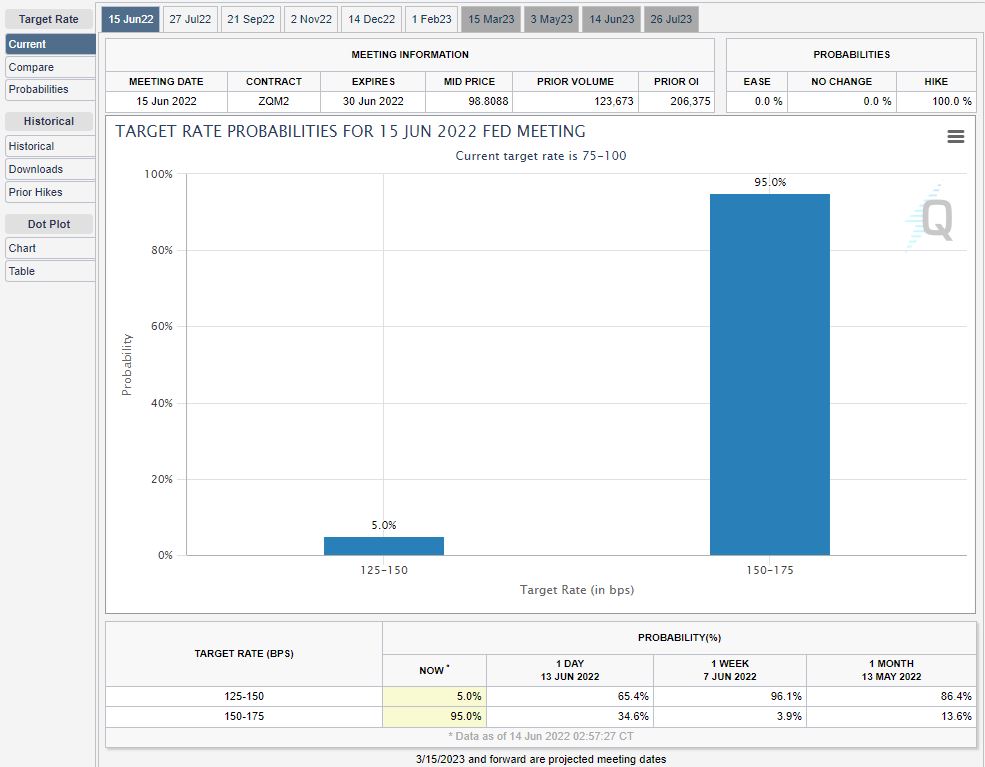
Chart prepared by James Stanley
But, the reporter that wrote the article is well-placed with the Fed and the thought is that he has some solid sourcing. And given the dire state of inflation at this point, the Fed needs all of the help that they can get so if they’re planning another 50 bp hike in July and another in September, why not just go 75 tomorrow and evaluate July and September when they get there?
This makes sense but, it also falls away from the pattern that we’ve become accustomed to around the Fed who has telegraphed their moves well in-advance.
So, tomorrow brings some intrigue. But, regardless of whether its 50 or 75, tomorrow’s move is unlikely to tackle inflation in its entirety so the bigger question is what else the Fed has in store. Tomorrow is a quarterly meeting, meaning that we’ll have updated forecasts which will show where the bank sees rates, inflation and growth heading in the coming months and quarters.
Perhaps the most bullish thing going ahead of tomorrow’s rate decision is just how bearish markets seem to be. And to be sure, the Fed hasn’t given much motive to think otherwise, saying that they’re trying to engineer a ‘soft landing.’ And while little has seemed to work well for equity bulls this year, sentiment matters – and if everyone that wants to be short already is – and tomorrow produces no new bearish stimuli, well we may see a counter-trend move.
This would be similar to what showed at the FOMC rate decision in March. At that point the bank was expected to hike rates for the first time in this cycle while also announcing plans for QT, addressing the $8 trillion balance sheet that’s ballooned through the pandemic. When they avoided that topic and instead just hiked rates by 25 bps, equities flew higher – with the S&P 500 gaining more than 12% into month-end while the Nasdaq 100 jumped a whopping 17.97% by the end of March.
So, remain cautious because there’s no free lunch here, even when markets are convulsing with fear – and especially when volatility levels are shooting higher.
Strategy for Tomorrow
For those looking to play bearish continuation themes, tomorrow can produce challenge. We’re largely hanging at lows in both the S&P and the Nasdaq and there’s a major driver on the horizon. And surely, that major driver might compel more sellers to sell even more. But, this is far from a certainty and, if anything, the alternative scenario should be entertained, as well. For those that are looking at continuation scenarios, breakout strategies could be a way of moving towards those already-stretched environments, which you can learn more about from the link below:

S&P 500
The blue chip index has lost a little over 1/5th of its value so far this year. And, so far in June the S&P has lost 9.7% which would be the largest monthly sell-off so far this year if it holds, and that’s impressive considering that we haven’t even hit the half-way point in June yet.
But, this does highlight a stretched market ahead of tomorrow. From the weekly chart below, we can see the sell-off stretching to fresh lows this week, crossing the 38.2% Fibonacci retracement of the pandemic move that’s priced-in since March of 2020.
S&P 500 Weekly Chart
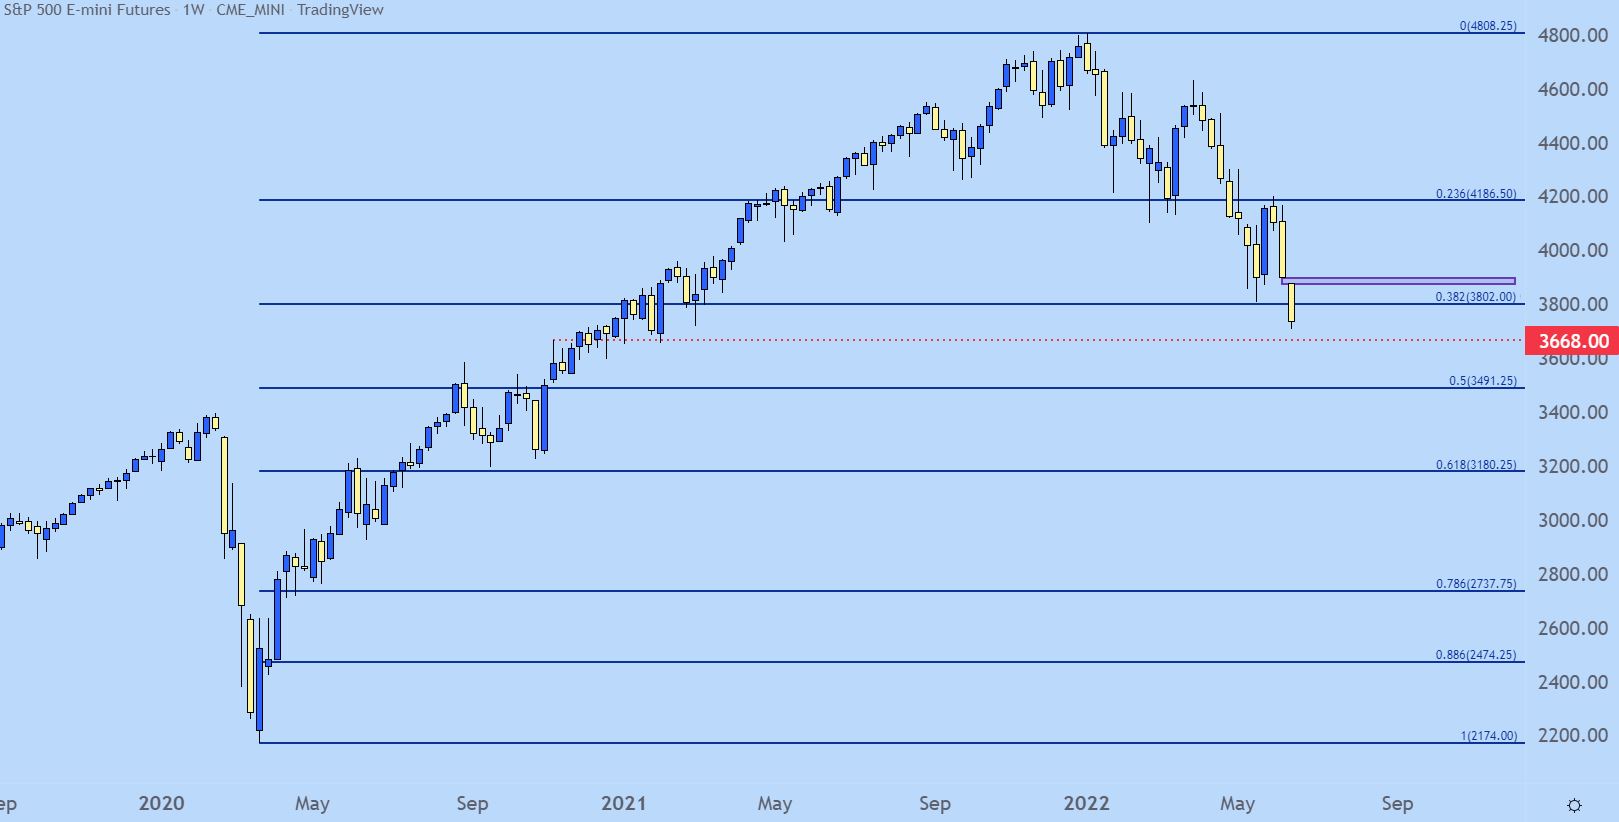
Chart prepared by James Stanley; S&P 500 on Tradingview
S&P Shorter-Term
It’s been an especially brutal week so far after sellers made a loud re-appearance last week.
The S&P 500 gapped-down and just continued to sell-off. But – there’s some unfilled gap that could become of interest here if we do see a bounce starting to develop. At this point, there’s resistance potential at the 38.2% retracement looked at above, that plots at 3802, and above that the gap runs from around 3896 up to around 3907.

S&P 500 Two-Hour Price Chart
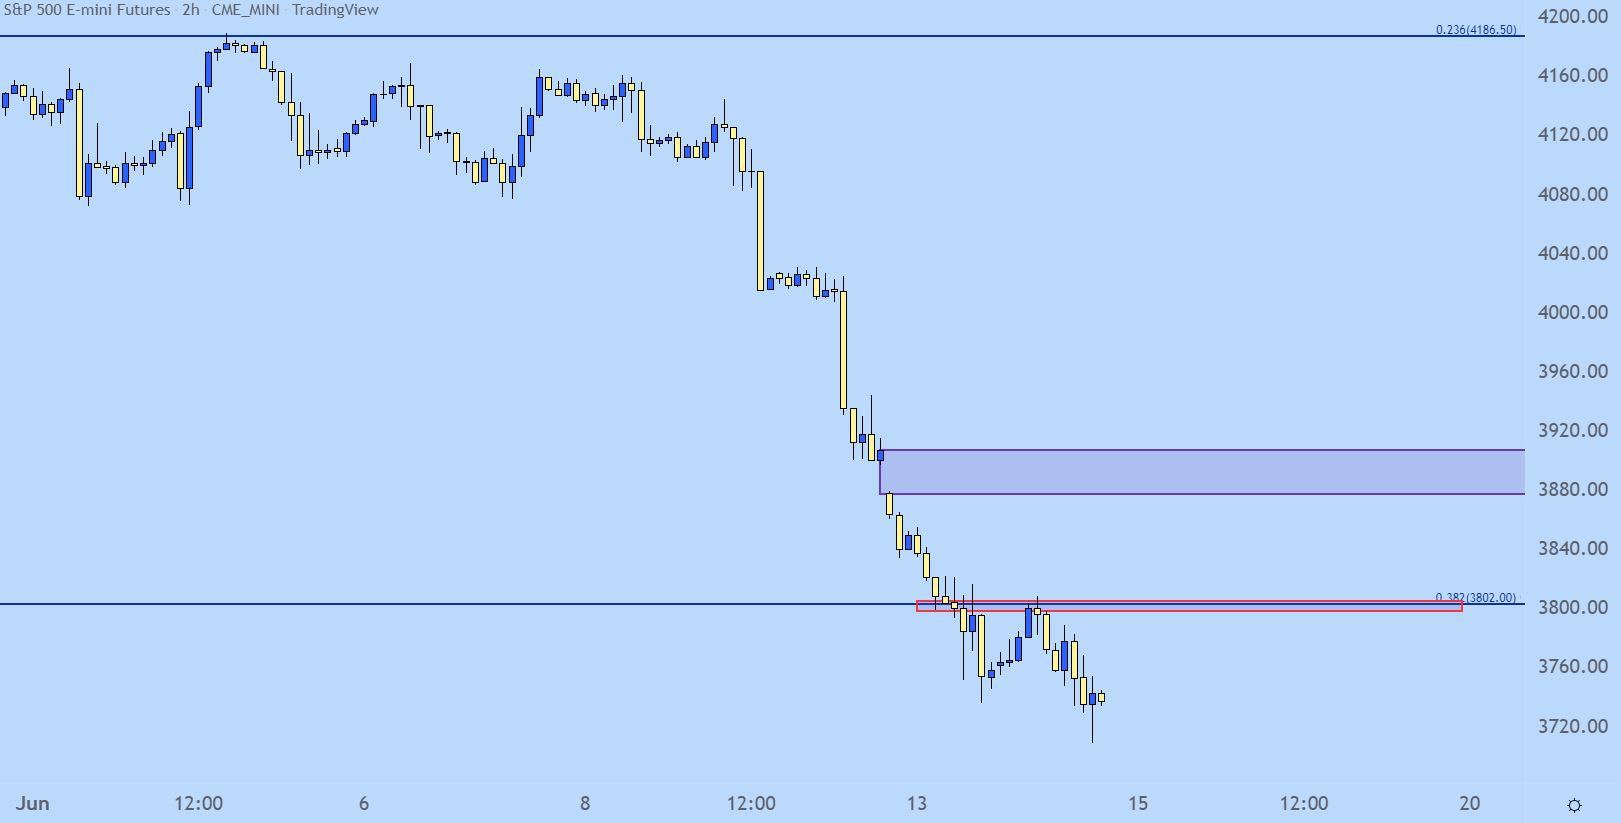
Chart prepared by James Stanley; S&P 500 on Tradingview
Nasdaq 100
The tech-heavy index actually looks a bit more stable to me at this point, which is surprising given that the Nasdaq has lost about 33% from the high while the S&P 500 has been down by 22%. But, the Nasdaq hit some support yesterday that’s held so far today.
That support level is the 50% marker of the 2018-2021 major move. Notably, that low in 2018 came in just after the Fed began to capitulate from their last rate hike cycle. Markets were spiraling lower in Q4, 2018 as the bank set up to hike for a fourth time that year. Just after the hike as markets were continuing to melt, Fed-speak started getting dovish all-of-the-sudden and, low and behold we ended up getting three rate cuts in 2019. But, that inflection point opened the door to a bullish trend that largely lasted until Covid came into the equation.
Nasdaq 100 Daily Price Chart

Chart prepared by James Stanley; Nasdaq 100 on Tradingview
Nasdaq 100 Shorter-Term
Going down to a shorter-term chart and we can see where there’s no evidence yet of bears relenting. We just saw a quick test below that support before buyers pulled it back-above ahead of the close but, the lower-highs that have been printing, coupled with that support test, highlight bearish potential as Nasdaq futures move into the Asian session.
But, if this support holds there could be scope for reversal scenarios in the index. If it doesn’t hold, there’s not much nearby support and the next zone that I’m following on the underside of the Nasdaq begins around 10,750.

Nasdaq 100 Weekly Price Chart

Chart prepared by James Stanley; Nasdaq 100 on Tradingview
--- Written by James Stanley, Senior Strategist for DailyFX.com
Contact and follow James on Twitter: @JStanleyFX


