


US Dollar Talking Points:
- The US Dollar is putting in a bounce from the s1 area of support looked at coming into this week. Price had built in a falling wedge formation, which took on the tone of a bull flag. The big question now is one of continuation.
- For USD-continuation drives, a key point is whether EUR/USD and/or GBP/USD can put in prolonged bearish moves. USD/JPY is tip-toeing up to the 150.00 level as fear of intervention remains, and USD/CAD has been in the midst of a wild ride of late, after last week’s CPI-fueled breakout snapped back to key support.
- The analysis contained in article relies on price action and chart formations. To learn more about price action or chart patterns, check out our DailyFX Education section.

We are now in earnings season in the US which means there’s another major market driver in town. This will put emphasis on a lot of subjective criteria as what executives from US corporates say can begin to mold earnings expectations for the coming quarters. The big question at this point is how impacted firms have felt from the quick and fast rise in rates. Perhaps more important is what they expect to happen in the near-term as we’ve seen a massive difference in the backdrop since just January of this year.
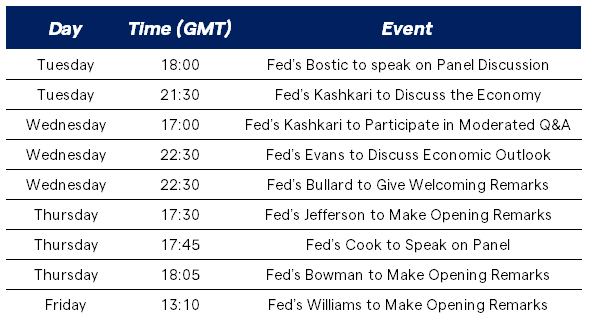
Earnings won’t be the only market driver, however, as we’re also well-entrenched in a busy schedule of Fed-speak and this is something that’s had an overwhelmingly-bullish focus on the US Dollar (and, in-turn, bearish for stocks) as Fed members continue to remind everyone that they’re not nearing finished in terms of rate hikes. Our own Brendan Fagan is compiling a regular piece on the topic of Fed-speak and the below calendar is taken directly from his article that was published on Monday.
Fed-speak for This Week
US Dollar
I wrote about this at-length in the weekend forecast as the USD remains in a very stretched manner long-term. DXY is overbought via RSI on both the Monthly and Weekly charts with that Monthly read at its highest level since 2015. And on the weekly – RSI has been diverging with lower-highs on the indicator even as price has put in higher-highs; commonly tracked for an indication of possible reversal.
A key point here: Oversold and overbought are contextual and, at least in my opinion, sub-optimal for timing. And as we saw in late-September in the British Pound, collapse-like moves often happen from oversold conditions when there’s a dearth of buying interest to hold-up support. The fact that USD hasn’t showed a deeper retracement and taken with the fact that price has been defended at some key supports – such as what we saw a couple weeks ago – highlights that continued bullish backdrop in the USD.
From a fundamental perspective – it’s somewhat of a rare situation: The global safe-haven is also one of the highest yielders. And that type of backdrop can continue to support a stretched scenario, such as we’ve seen over the past couple of months. The bigger question is going to be related to counterparts like the Euro or British Pound.
In the USD – that late-month collapse in GBP pushed the early-month spike in the USD. So, while it looks very toppy from monthly and weekly charts, helped along by that dynamic, what has showed shorter-term feels considerably more-bullish.
US Dollar Weekly Price Chart
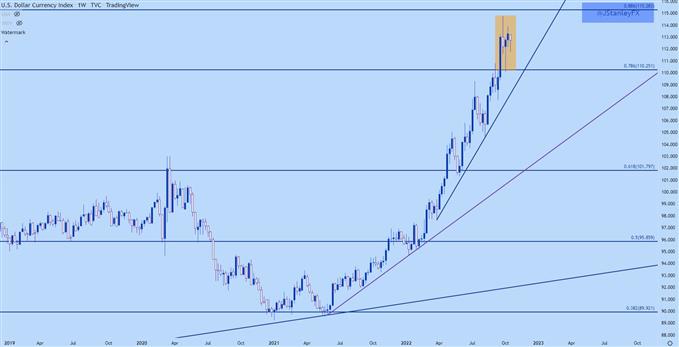
Chart prepared by James Stanley; USD, DXY on Tradingview
As GBP/USD recovered in early-October trade, USD pulled back and that move priced-in very quickly. But – the sell-off stopped right at support taken from prior resistance, at the 110-110.25 zone. Price action then built-in an ascending triangle pattern, often followed with the aim of bullish breakouts – and that formation began to hit a few days later.
By the time we got to last week’s CPI report, the USD had already put-in a sizable bounce from support. A quick flare of strength after the release of that data was faded, and prices began to pullback until running into another spot of higher-low support on Monday.
Again, we have an example of support taken from prior resistance – this time from the neckline of the ascending triangle.
And the pullback in USD has even shown in a somewhat orderly fashion, building as a falling wedge formation that functions similar to a bull flag. That was broken-through overnight and we now have the prospect of bullish continuation scenarios.
US Dollar Four-Hour Price Chart
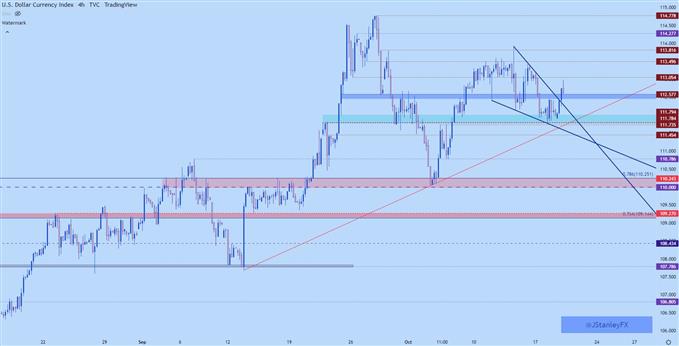
Chart prepared by James Stanley; USD, DXY on Tradingview
USD Shorter-Term: Make the Trend Show it’s Hand
At this point, we have the prospect of a fresh short-term breakout in the same direction as a well-built longer-term trend. The big question, of course, as always will be the case, is one of continuation. I’m utilizing largely the same levels that I’ve been using over the past few weeks but there’s a big zone of support-turned-resistance that’s sitting just underneath price, and this plots from around 112.45-112.58. A hold there would be a show of higher-low support to go along with a recent higher-high.
If prices breaks-below that – there’s still residual hope for support plays off of the 111.74 zone, although that wouldn’t look as attractive for topside plays as we would then have a lower-high via price on a longer-term basis and, at that point, we may be nearing the build of a descending triangle. But – it’s support until it’s not.
On the topside of price – it’s the 113.50 level that looms large. There were multiple tests there last week and buyers were unable to leave it behind. 113.82 is above that, followed by 114.28.
US Dollar Two-Hour Price Chart
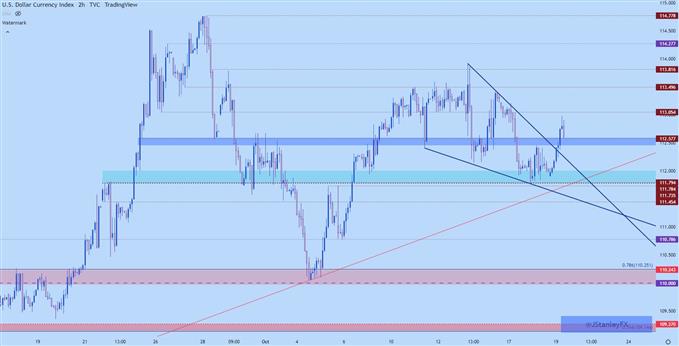
Chart prepared by James Stanley; USD, DXY on Tradingview
EUR/USD
I think the biggest constraint to DXY directional scenarios will be the Euro in the near-term.
With natural gas prices in Europe falling there’s a bit of worry that’s whittling away and while Europe is far from a ‘safe place,’ economically speaking, there seems to be a bit less on the doom-and-gloom side, at the moment.
But, speaking to the stretched nature of the USD on a longer-term basis we have essentially the mirror image of that scenario in the EUR/USD. Fear has been a big driver in this matter and the quandary around energy has certainly played a role. The big question is whether that fear can continue to push prices lower at the same frenzied pace that’s been at-play for the past eight months.
EUR/USD Weekly Chart
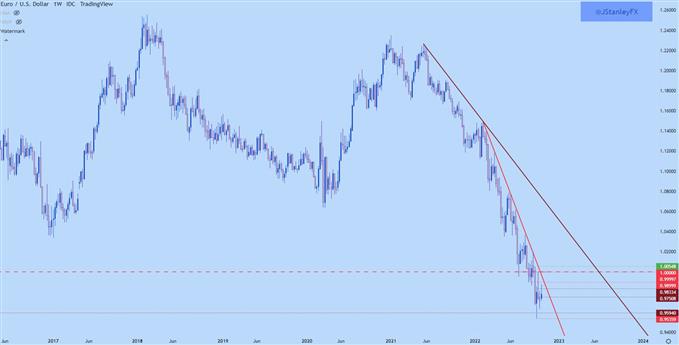
Chart prepared by James Stanley; EURUSD on Tradingview
EUR/USD Shorter-Term
Parity gave a strong response in early-October and that’s what helped to contribute to the USD lift-off from support. The bigger question, again, is whether the pair can continue to draw in fresh shorts below the .9800 handle, even as the fear around energy in Europe appears to be dissipating a bit.
At this point, there’s a possible support level around the psychological level of .9750 and if that doesn’t hold, the next area of emphasis is .9670, with a test through that level also amounting to a break of the bullish short-term trendline.
EUR/USD Daily Chart
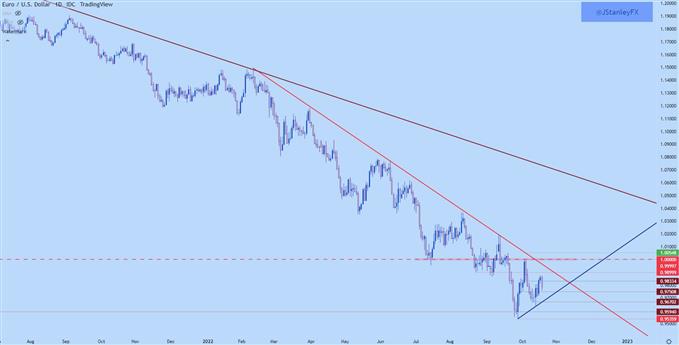
Chart prepared by James Stanley; EURUSD on Tradingview
GBP/USD
On a shorter-term basis GBP/USD continues to look somewhat chaotic. Longer-term levels have seemed to be a bit more clear, at least in my estimation.
If we are going to see a strong USD-push, I’d look for it to come from weakness in the British Pound. The pair remains well-above the collapse-like levels that were in-play in late-September. The fundamental situation around the UK remains somewhat opaque. But, at this point, prices are holding higher-low support taken from a spot of support-turned-resistance. This plots around 1.1219, and the 1.1354 level continues to mark near-term resistance in the pair.
A breach of that support, however, and perhaps more to the point, a push below the 1.1150 swing low, would amount to a trendline break of the recovery move which could then re-open the door for another test at the 1.1000-1.1023 zone of support.
GBP/USD Four-Hour Chart
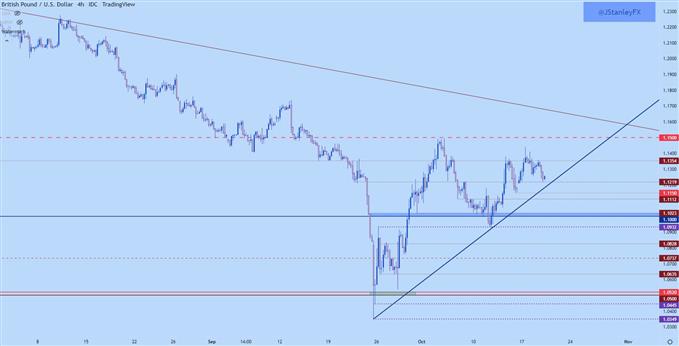
Chart prepared by James Stanley; GBPUSD on Tradingview
USD/CAD
We just got another inflation report out of Canada this morning but for the USD/CAD pair, it’s been a busy past week.
The pair flared-higher on the back of the US CPI release last week, breaking-out of both an inverse head and shoulders pattern and an ascending triangle. The move didn’t last for long, however, as a snap back move in the USD (and stocks) pushed for a snap back move in the USD/CAD pair.
Prices haven’t been able to re-test the high since that move although there has been a response from Fibonacci support at 1.3652. The 1.3700 level can also be of use, helping to establish a support zone in the pair, and if sellers can push through that, then the 1.3500 psychological level comes back into the picture. For near-term resistance, I’m tracking that at the 1.3833-1.3850 area.
USD/CAD Four-Hour Chart
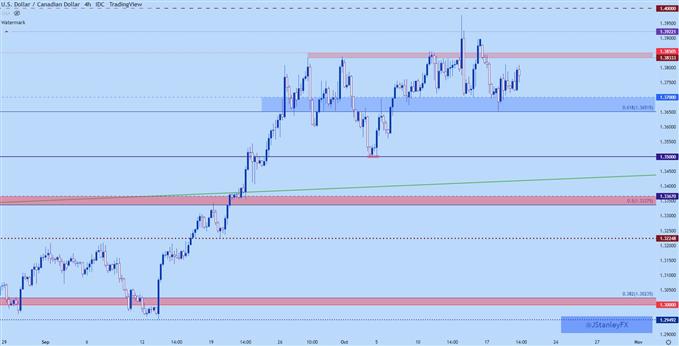
Chart prepared by James Stanley; USDCAD on Tradingview
USD/JPY
Well the line in the sand was thought to be at 145 and this is even where we saw the Bank of Japan act in late September but, at this point, we’re almost 500 pips above that!
As I’ve been talking about – the carry remains positive here and as long as Japanese monetary policy remains in its current state and the US is still hiking – that fact will remain. And as we’ve heard from BoJ Governor Kuroda, a weak Yen isn’t all that bad for Japan and it doesn’t seem to be creating much worry at the central bank. At the Ministry of Finance, however, the same can’t be said as that’s who ordered the intervention late last month.
The big question now is whether something similar will happen at the 150 psychological level which is getting closer and closer. And – if it does – will the BoJ try something different? Or will they do the same thing they did a month ago that didn’t really work – as it essentially just bought down a trade in a counter-trend manner that their own monetary policy is encouraging. After the last intervention on 9/22 prices were pretty much back up to that 145.00 level within a few days, just as I had pointed out right after the intervention took place.
The risk on the upside here is another intervention. And perhaps even some type of a change in policy although there’ve been no signals of such from the BoJ as yet. But, the pair could look a lot more attractive after a pullback, such as we looked at on 9/23, as an intervention of that nature simply looks like a stop run to keep markets on their toes from getting too comfortable in a prolonged trend.
USD/JPY Four-Hour Price Chart
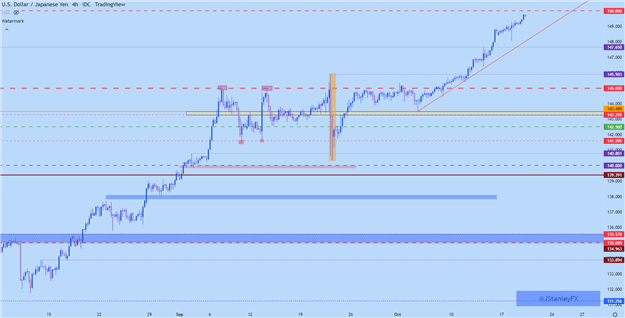
Chart prepared by James Stanley; USDJPY on Tradingview
--- Written by James Stanley, Senior Strategist, DailyFX.com & Head of DailyFX Education
Contact and follow James on Twitter: @JStanleyFX


